
About this dataset
- ·Covers 2020-01-01 – 2026-10-09
- ·9.5M rows (live estimate)
- ·Resolution: hourly
- ·All 36 states & UTs — subset at checkout
- ·Exports built fresh from the live database at purchase time
- ·Coverage report with every known gap disclosed (below)
₹2,499
Leave empty for all currently covered states. A subset is priced pro-rata (min 40%).
Enter your email above to check out as a guest, or continue to create a free account (purchases saved in My Products). Card payments via Stripe; pro-forma/bank transfer for institutions.
Sold by India Energy Atlas · CC-BY license · cite: India Energy Atlas (energymap.in), CC BY 4.0
Enterprise delivery
Need this landing in Snowflake, S3, or GCS on a schedule — or under an enterprise license with custom windows? We set up direct cloud delivery for enterprise customers.
Pro-forma invoicing and bank transfer available for institutional buyers.
About this dataset
Two complementary stores in one export: the reconciled per-state hourly series (anchored to Grid-India PSP daily totals - the cleanest per-state demand available) plus the deep modeled history that fills non-SLDC states and pre-reconciliation years.
The statistical meaning changes at 2025-09-20. Every earlier hour is a monthly average level placed on a fixed 24-hour climatological profile: there is no weekday effect, weather response or day-to-day peak variation, so a plotted week repeats the same day seven times. From 2025-09-20 onward the rows are modelled time series. Every exported row carries `series_type` (`climatological_profile` or `modelled_timeseries`) alongside its tier/source tag.
Coverage — measured, not promised
History begins in 2020. Rows before 2025-09-20 are labelled climatological_profile; rows at or after 2025-09-20 are labelled modelled_timeseries. The reconciled store begins in May 2024 and trails real time by ~2 days (NLDC PSP publish lag). Known sparse span Apr 25 - May 18 2026 in the reconciled store (upstream PSP gap), disclosed in coverage stats.
| state_hourly_energy | |||||||||||||||||||||||||||||||||||||||||||||||||||||||||||||||||||||||||||||||||||
|---|---|---|---|---|---|---|---|---|---|---|---|---|---|---|---|---|---|---|---|---|---|---|---|---|---|---|---|---|---|---|---|---|---|---|---|---|---|---|---|---|---|---|---|---|---|---|---|---|---|---|---|---|---|---|---|---|---|---|---|---|---|---|---|---|---|---|---|---|---|---|---|---|---|---|---|---|---|---|---|---|---|---|---|
| modeled_electricity_demand | |||||||||||||||||||||||||||||||||||||||||||||||||||||||||||||||||||||||||||||||||||
| 2019-12 | 2020-06 | 2020-12 | 2021-06 | 2021-12 | 2022-06 | 2022-12 | 2023-06 | 2023-12 | 2024-06 | 2024-12 | 2025-06 | 2025-12 | 2026-06 |
Known holes — disclosed, never hidden
- state_hourly_energy
- 6,93,186 rows
- 2024-05-01 – 2026-09-27
- modeled_electricity_demand
- 86,85,538 rows
- 2019-12-31 – 2026-10-04
Coverage stats generated 2026-09-28 by the weekly sample-assets pipeline · 93,78,724 total rows
Data dictionary
| Column | Type | Description |
|---|---|---|
| state_code | text | State slug, e.g. rajasthan |
| ts_hour | timestamptz | Hour start, UTC |
| demand_mw | numeric | Reconciled hourly demand, MW (PSP-anchored) |
| generation_mw | numeric | Reconciled hourly generation, MW |
| gen_by_fuel | jsonb | Per-fuel generation split |
| source_kind | text | actual / modeled / estimated_fallback / stale_carryforward |
| confidence | numeric | 0-1 confidence per the source taxonomy |
| refreshed_at | timestamptz | Last write |
| series_type | text | climatological_profile before 2025-09-20; modelled_timeseries from 2025-09-20 |
| Column | Type | Description |
|---|---|---|
| timestamp | timestamptz | Hour, UTC |
| state | text | Title-case state name |
| demand_mw | float | Modeled load, MW |
| source | text | modeled_concurrent_v1 / modeled_concurrent_nonsldc_v1 / modeled_ml_v1 / modeled_ml_forecast_v1 / ... |
| inputs_json | jsonb | Method metadata, weights, calibration factors |
| series_type | text | climatological_profile before 2025-09-20; modelled_timeseries from 2025-09-20 |
Caveats — read before you buy
- Hourly state values are modelled. For most states the measured all-India demand is allocated to states by each state's recent official peak (Grid-India PSP). No state delivered metered hourly demand in the 30 days to 22 September 2026; the last metered hours are from 7 July 2026.
- Rows before 2025-09-20 are a monthly climatology. The deep modelled history repeats one fixed 24-hour shape at a monthly level, with no weekday, weather or day-to-day peak variation. Reconciled rows from May 2024 carry a daily level from Grid-India PSP totals on a modelled intraday shape. Both are labelled `climatological_profile`.
- Delhi's roughly 20% hourly WAPE is the error of that monthly climatology; it is not model accuracy for a day-resolved time-series model.
- Reconciled tier trails ~2 days (PSP publish lag).
- Modeled rows are estimates; series_type and tier/source columns disclose their statistical form and provenance.
License & citation
CC-BY
Cite as: India Energy Atlas (energymap.in), CC BY 4.0
Frequently asked
What exactly do I get when I buy State Electricity Demand, Hourly (36 States)?
A one-time export built fresh from the live India Energy Atlas database at purchase time, delivered as csv_gz via a private tokened download link, with a per-state/per-month coverage report and a data dictionary included. History begins in 2020. Rows before 2025-09-20 are labelled climatological_profile; rows at or after 2025-09-20 are labelled modelled_timeseries. The reconciled store begins in May 2024 and trails real time by ~2 days (NLDC PSP publish lag). Known sparse span Apr 25 - May 18 2026 in the reconciled store (upstream PSP gap), disclosed in coverage stats.
How is this licensed?
CC BY 4.0 — use it anywhere, including published work, with attribution: "India Energy Atlas (energymap.in), CC BY 4.0".
How fresh is the data and how are gaps handled?
The catalog shows live freshness straight from the source tables (15-minute server cache). Exports are built at purchase time, and every known multi-day gap is disclosed in the coverage report on this page — we never sell around a hole silently.
Can I configure the date range and states?
Yes — the configurator lets you pick the time window, states and format before checkout, and the price scales with the window you pick.
Do you offer pro-forma invoices or bank transfer?
Yes. Institutional buyers can request a pro-forma invoice and pay by bank transfer; the order unlocks automatically once payment is marked received. Stripe checkout (cards/UPI) is available for self-serve purchases.
Buyers also explored
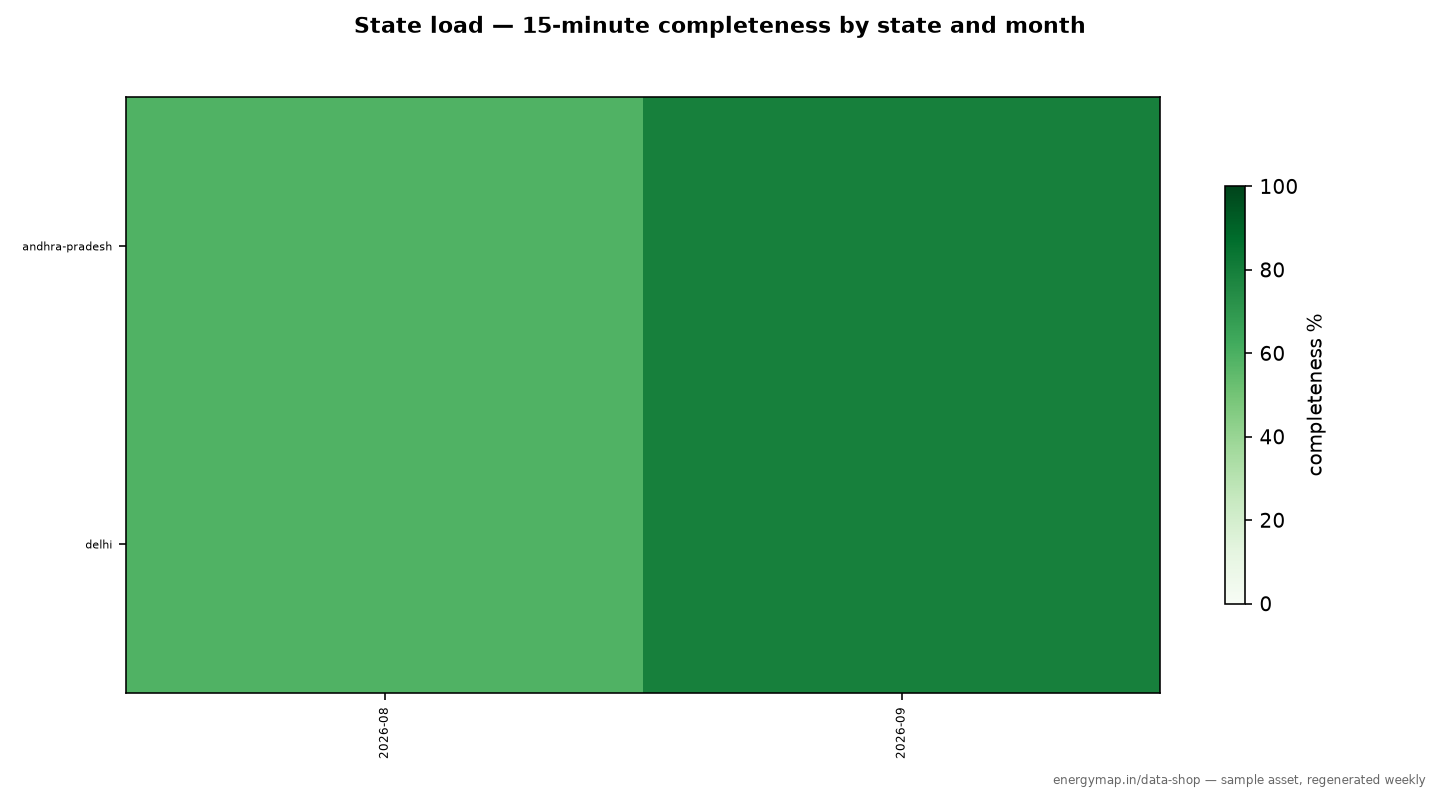
State Electricity Load, 15-Minute: Delhi and Andhra Pradesh
from ₹2,499
2026-08 – 2026-09
View and buy
IEX Market Historical (DAM + RTM + G-DAM + REC)
from ₹2,499
2022-01 – 2026-10
View and buy
IEX Bid-Area Prices & Congestion Divergence
from ₹2,499
2022-01 – 2026-10
View and buy
← All datasets·Source: India Energy Atlas · api.energymap.in · coverage and samples regenerated weekly