Data Shop

India's grid data, packaged to buy

One-time exports built fresh from the live Atlas database: market prices, demand, fuel mix, carbon, weather and infrastructure. Live coverage on every card, known gaps disclosed — never sold around.

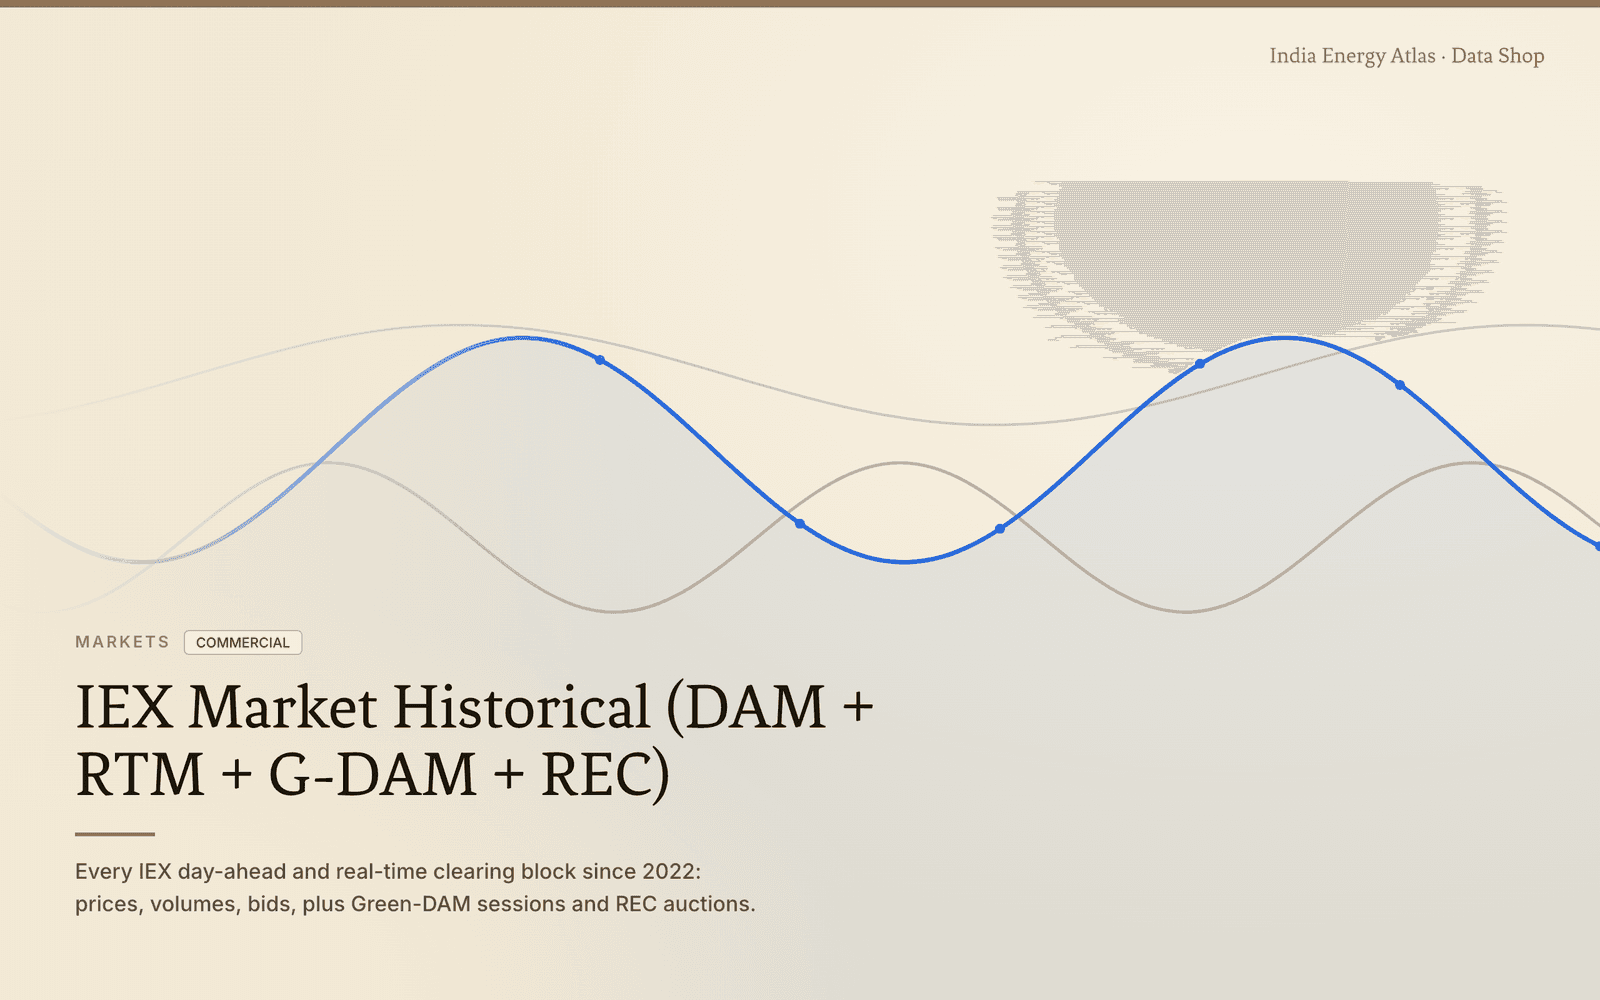
Conceptual illustration of wholesale electricity price-waves and market-clearing curves, in the India Energy Atlas brand palette
updated <1h agoCommercial495K rows

Every IEX day-ahead and real-time clearing block since 2022: prices, volumes, bids, plus Green-DAM sessions and REC auctions.

from ₹2,499

2022-01 – 2026-10

Conceptual illustration of diverging bid-area price bands and a congestion corridor, in the Atlas brand palette
updated 25h agoCommercial2.0M rows

Bid-area level price separation (N1/S1/E1/W1/A1) since Dec 2021, with derived corridor divergence aligned to Grid-India ATC revisions.

from ₹2,499

2022-01 – 2026-10

Conceptual illustration of stacked generation bands rendered in the Atlas fuel-mix palette (coal, solar, wind, hydro)
updated 2h agoCC-BY8.6M rows

Modelled hourly generation by fuel for every Indian state since Dec 2019 - thermal, hydro, solar, wind, nuclear, gas - with source tags and confidence. Before 2025-09-20 it is a monthly climatology.

from ₹2,499

2019-12 – 2026-10

Conceptual illustration of a smooth electricity-demand curve over a calm Atlas-cream field
updated <1h agoCC-BY9.5M rows

Hourly state demand since 2020. Before 2025-09-20 it is a monthly climatological profile repeated on a fixed 24-hour shape, not a day-resolved time series.

from ₹2,499

2020-01 – 2026-10

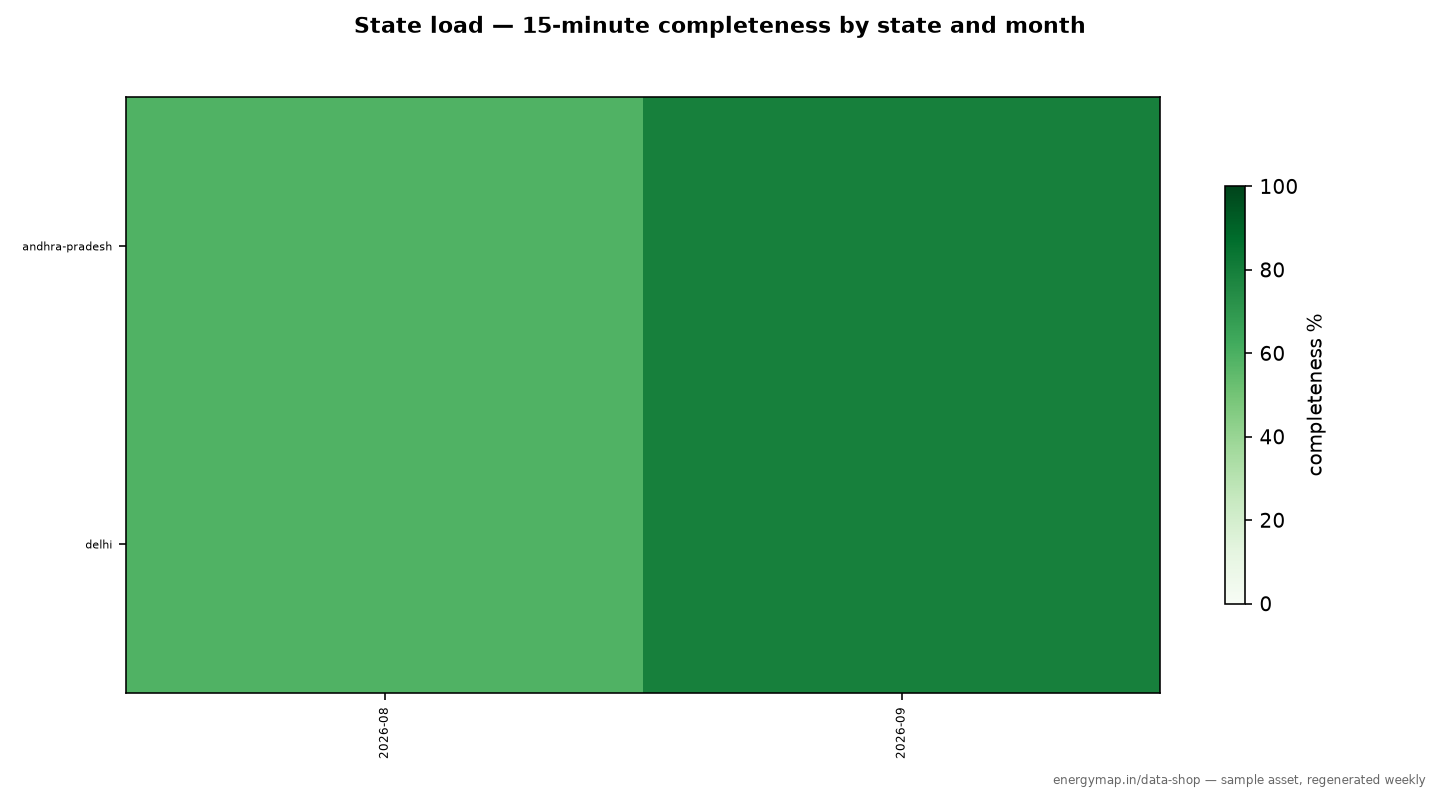
State Electricity Load, 15-Minute: Delhi and Andhra Pradesh sample plot
updated 5d agoCC-BY8K rows

Served electricity load in 15-minute blocks for two states, Delhi and Andhra Pradesh, with every row labelled as metered or anchored reconstruction and carrying its uncertainty and anchor provenance.

from ₹2,499

2026-08 – 2026-09

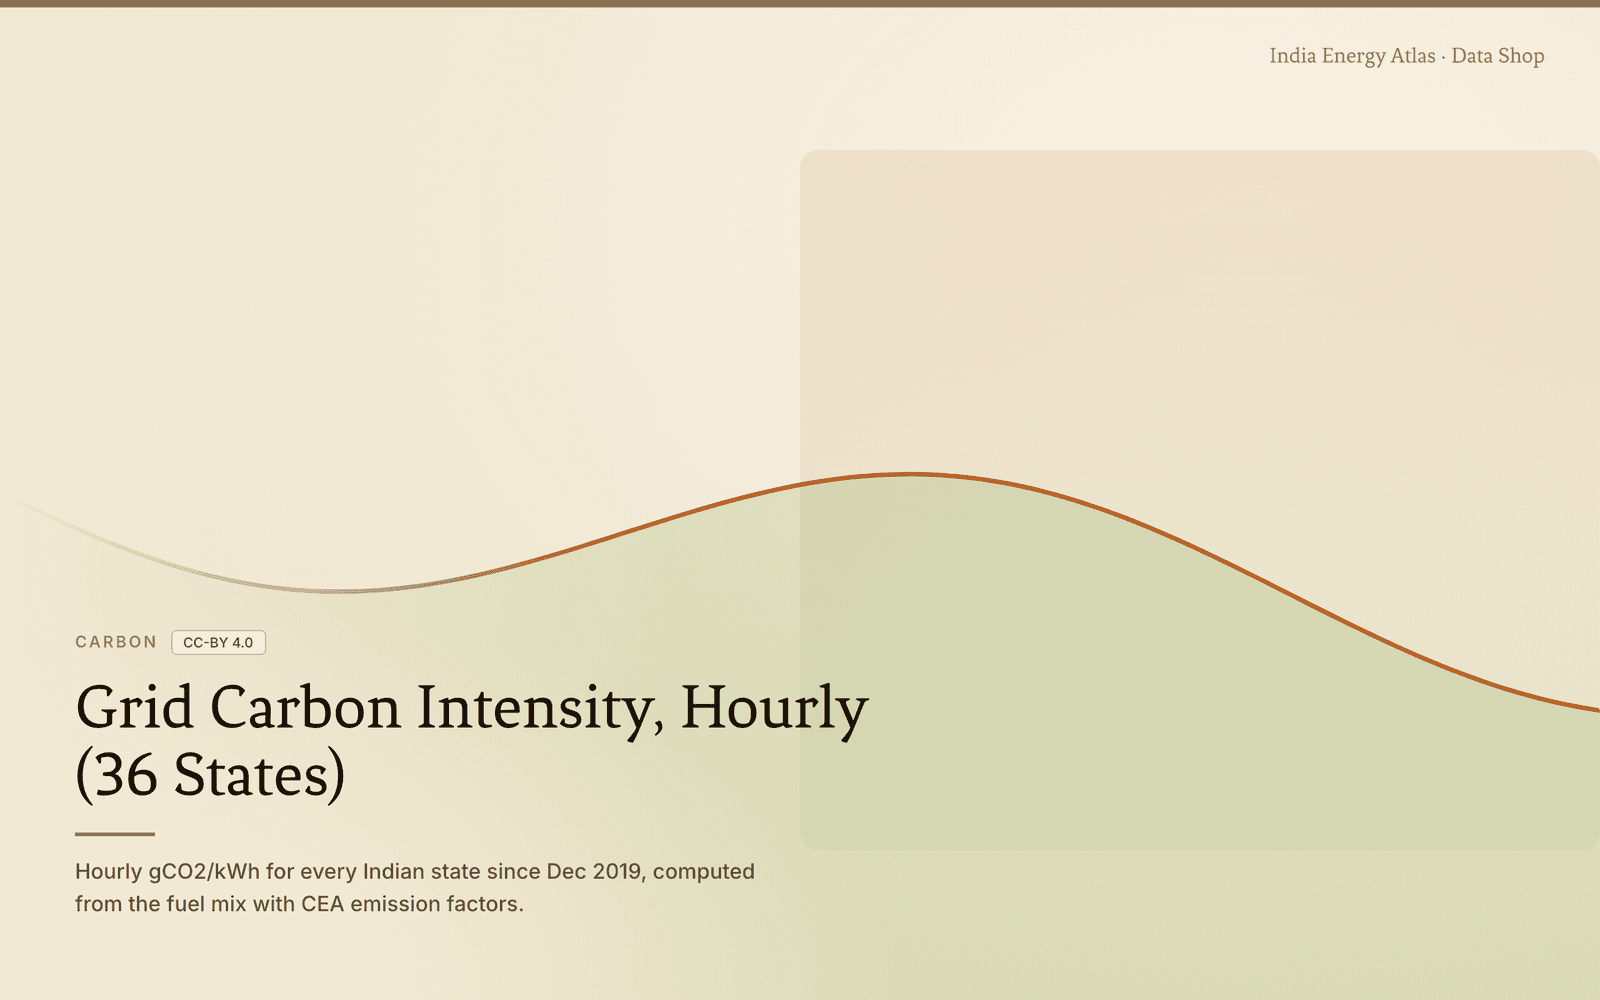
Conceptual illustration of a grid carbon-intensity gradient field descending from coal-brown to clean-green
updated 2h agoCC-BY11.1M rows

Hourly production-based gCO2/kWh for every Indian state since Dec 2019, computed from the modelled fuel mix with CEA emission factors.

from ₹2,499

2019-12 – 2026-10

Conceptual ledger grid evoking an archive of daily power-supply-position records, in the Atlas brand palette
updated 43h agoCC-BY79K rows

Grid-India's daily Power Supply Position since Apr 2021: peak demand, demand met, shortage, energy met and frequency band per state and region.

from ₹2,499

2021-04 – 2026-10

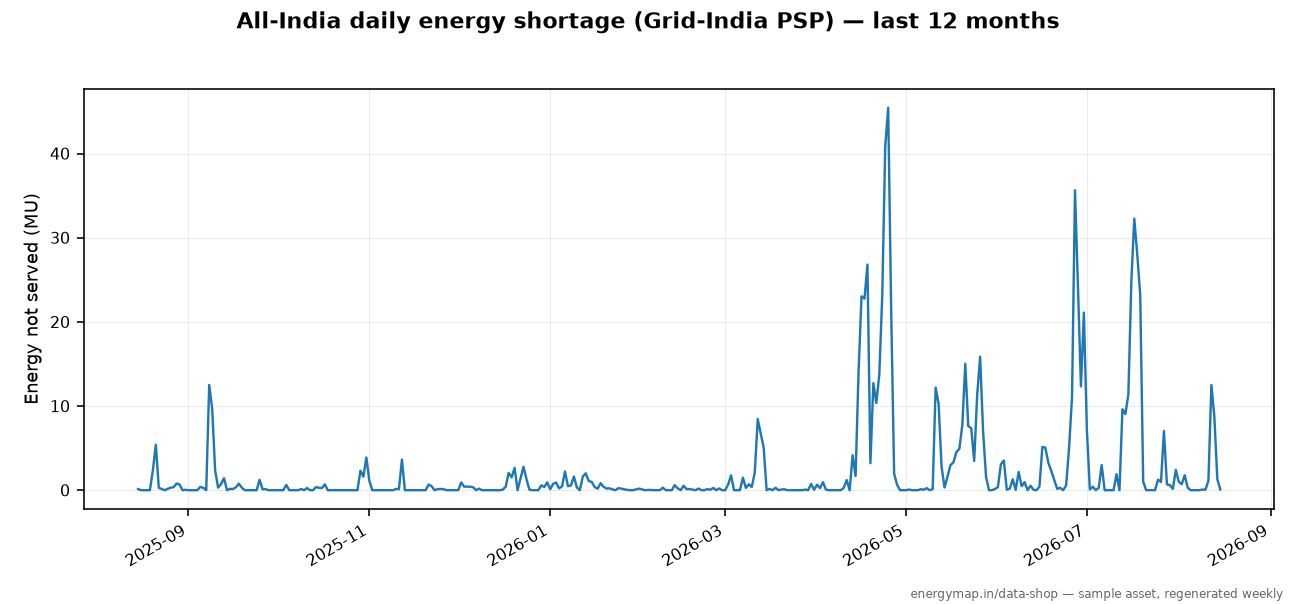
State Shortage & Deficit, Monthly sample plot
updated 43h agoCC-BY2K rows

How much power each Indian state went short, every month since Apr 2021 — energy not served, deficit %, and peak shortage, on 33 canonical reporting entities.

from ₹2,499

2021-04 – 2026-10

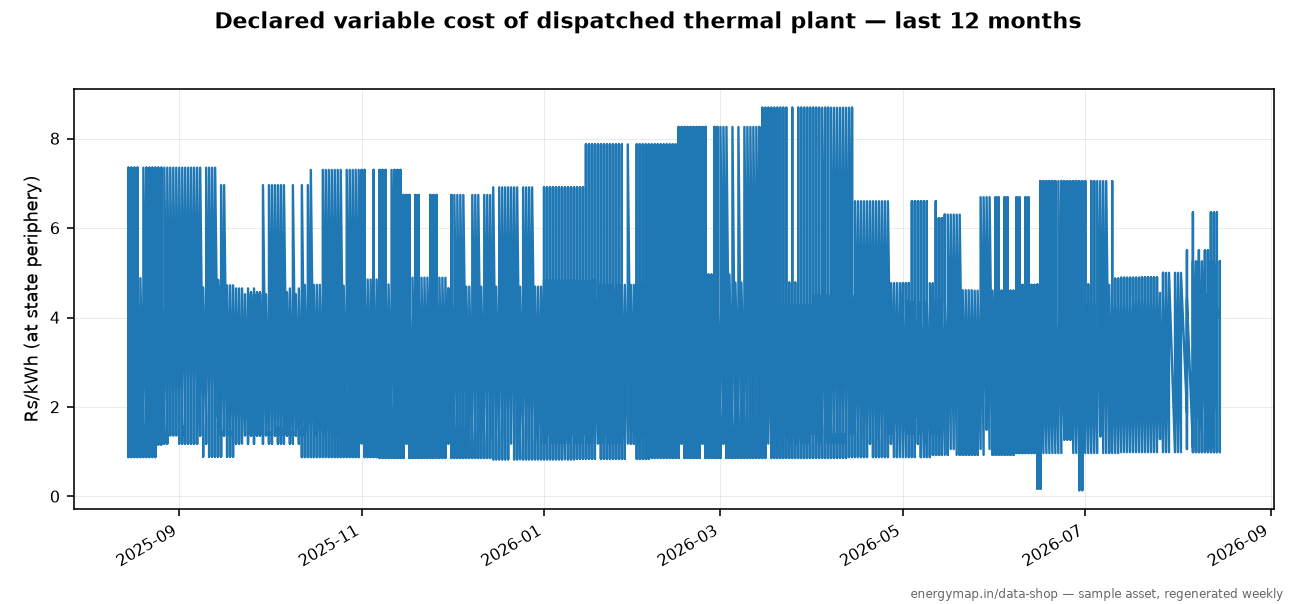
Coal Plant Variable Cost, Daily sample plot
updated 2d agoCC-BY2.7M rows

What every generating station declared it costs to run, to every state that buys from it, every day since 2018 — the merit order India dispatches on, 2.7 million contract lines.

from ₹2,499

2018-01 – 2026-09

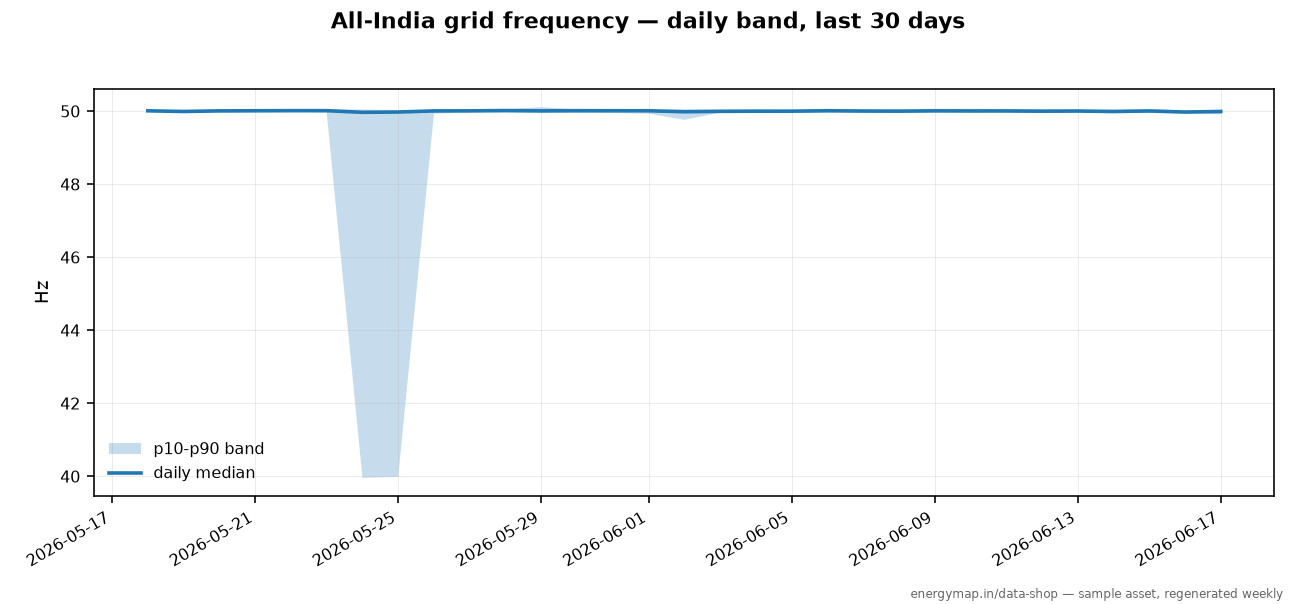
All-India Grid Frequency, 15-Minute Blocks sample plot
updated 2h agoCommercial132K rows

Every 15-minute block of India's grid frequency since Dec 2022 — 96 blocks a day, measured, continuous to real-time.

from ₹2,499

2022-12 – 2026-10

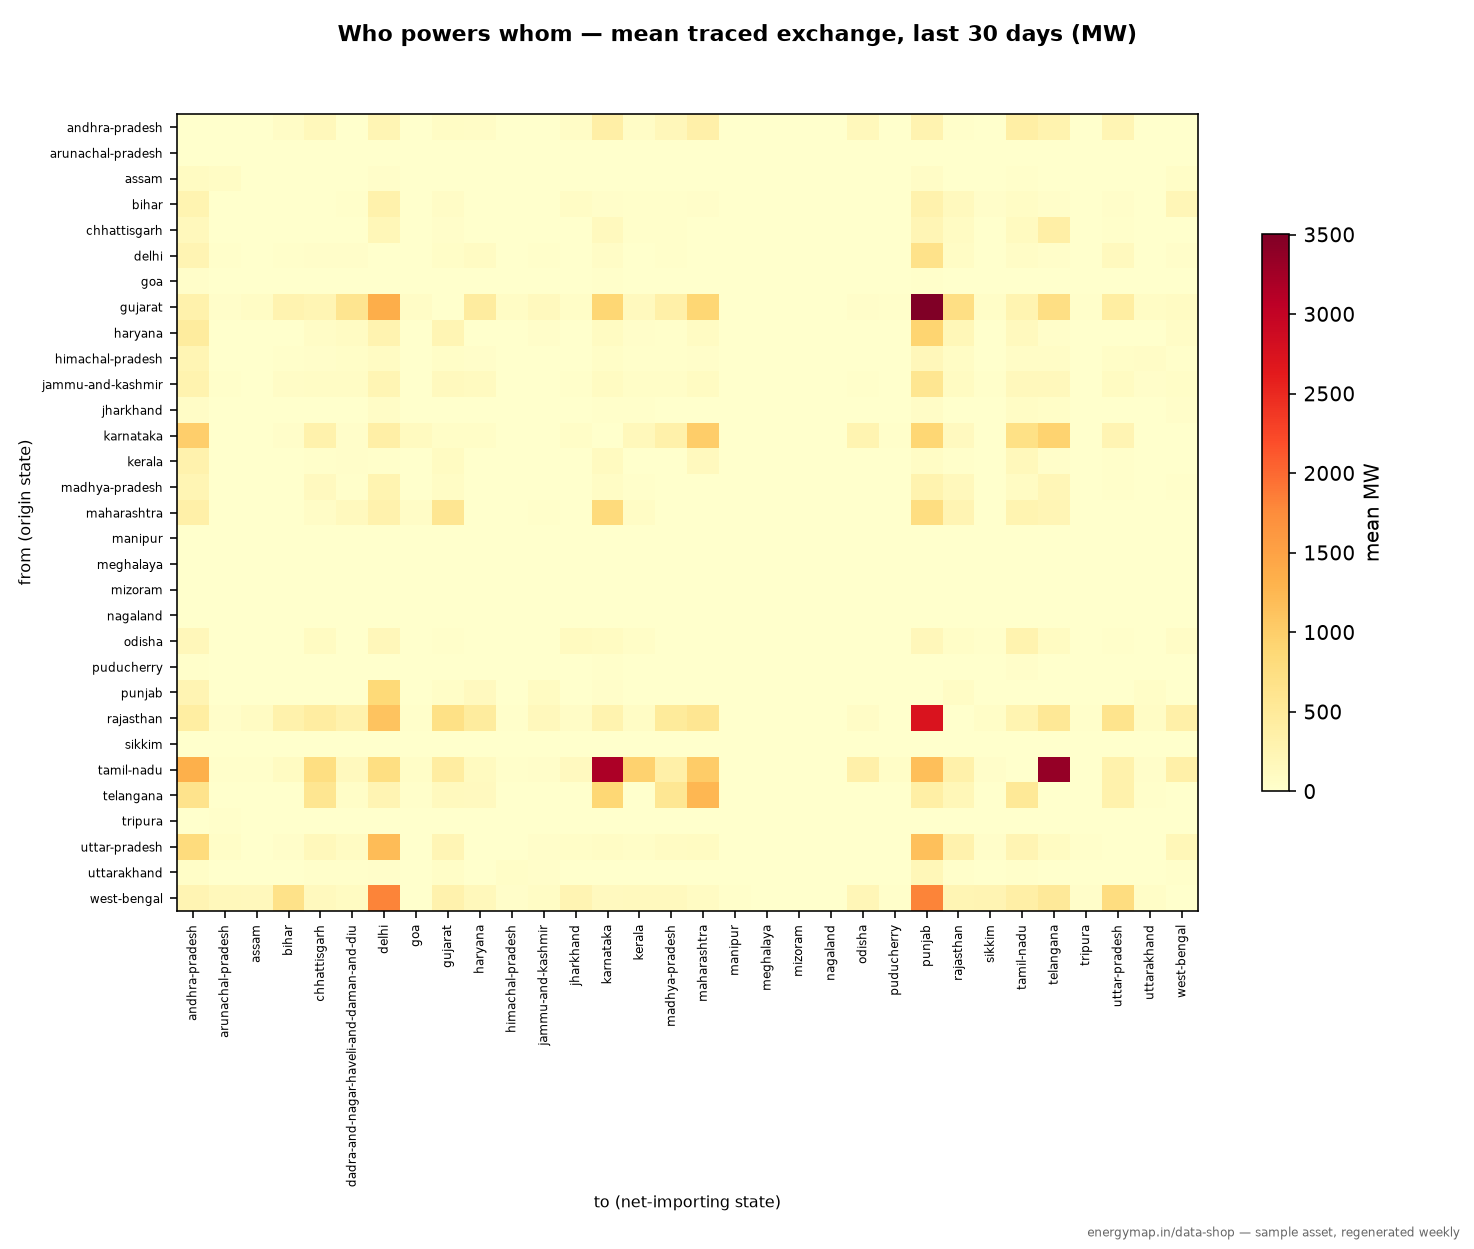
State-to-State Power Exchange Matrix, Hourly (Flow-Traced) sample plot
updated 4h agoCommercial212K rows

Who powers whom: the hourly state-to-state electricity exchange matrix for India, reconstructed by flow tracing — a dataset no one measures and no one else publishes.

from ₹2,499

2026-01 – 2026-10

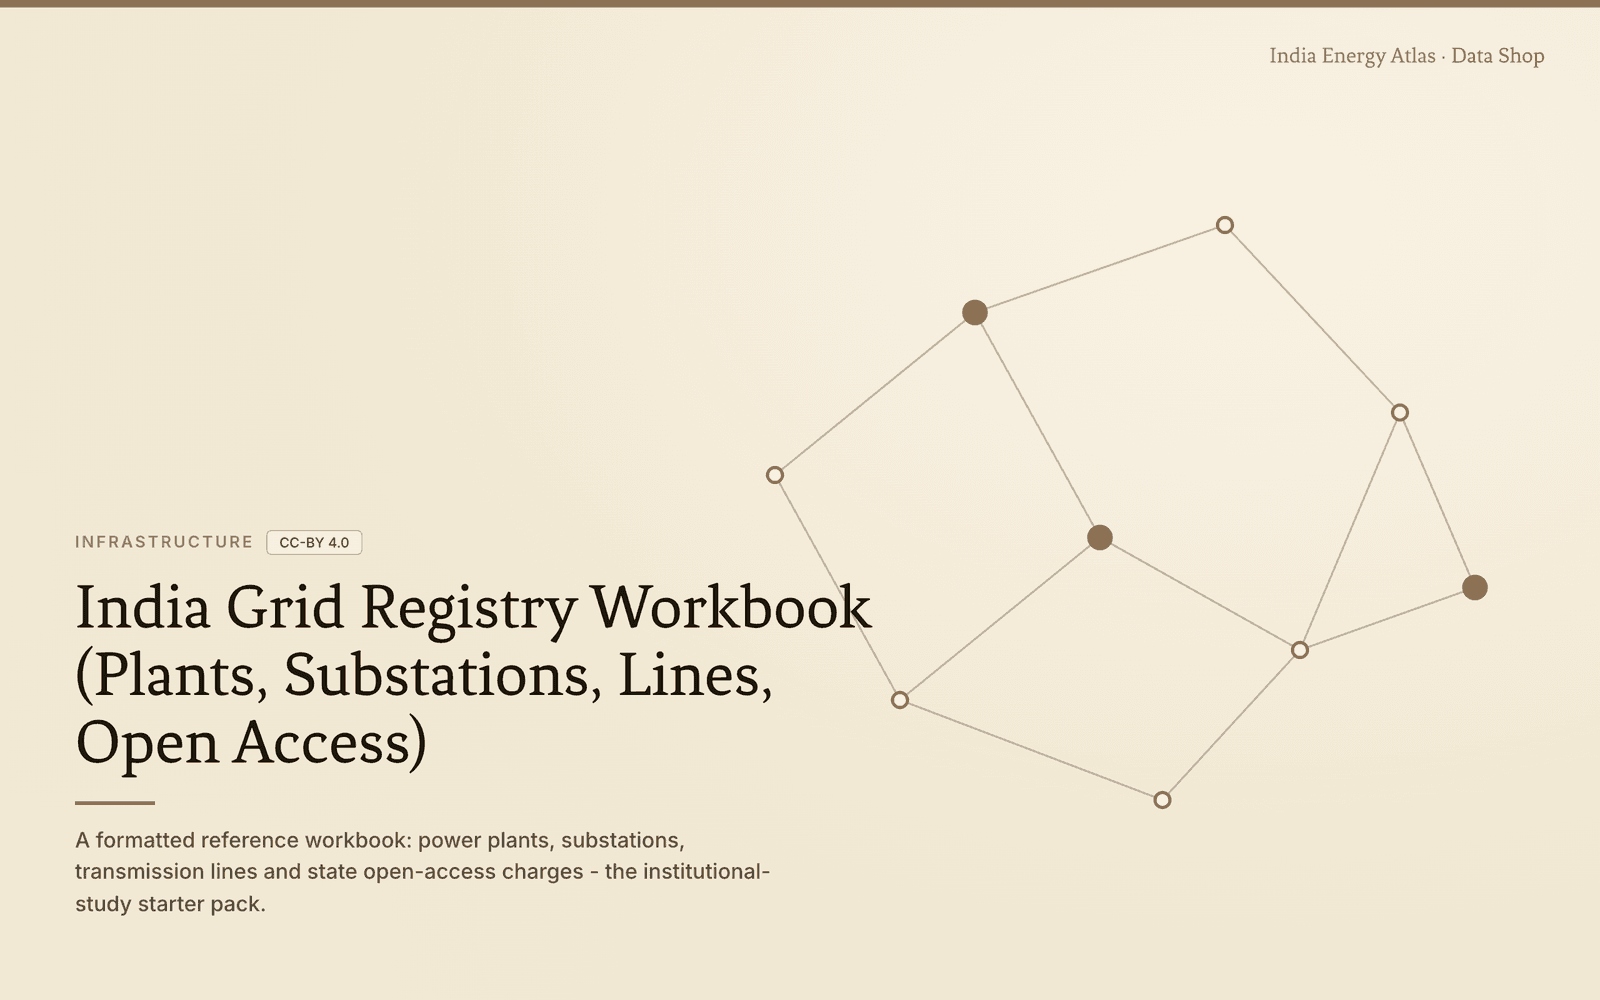
Conceptual node-and-link network evoking substations and transmission lines, in the Atlas brand palette
snapshot · as of 2026-06-01CC-BY1K rows

A formatted reference workbook: power plants, substations, transmission lines and state open-access charges - the institutional-study starter pack.

from ₹2,499

Reference snapshot

Need something custom?

Different window, different cut, a table that is not listed, or a formatted institutional workbook — tell us what you are building and we will hand-shape it. Most requests get a vetted sample within a day.

Enterprise delivery: need a dataset landing in Snowflake, S3, or GCS on a schedule — or under an enterprise license with custom windows? We set up direct cloud delivery for enterprise customers.

Freshness chips are computed live from the underlying tables (15-minute server cache). Row counts are live estimates where marked; otherwise dated baselines, served from api.energymap.in.