
About this dataset
- ·Covers 2026-01-22 – 2026-10-02
- ·212K rows
- ·Resolution: hourly
- ·All 32 corridor-connected states/UTs (island grids and Chandigarh excluded) — subset at checkout
- ·Exports built fresh from the live database at purchase time
- ·Coverage report with every known gap disclosed (below)
₹2,499
Leave empty for all currently covered states. A subset is priced pro-rata (min 40%).
Enter your email above to check out as a guest, or continue to create a free account (purchases saved in My Products). Card payments via Stripe; pro-forma/bank transfer for institutions.
Sold by India Energy Atlas · Commercial license · cite: India Energy Atlas (energymap.in) flow-traced model estimates, computed from SLDC/NLDC net-interchange measurements and the India Grid Graph transmission model
Enterprise delivery
Need this landing in Snowflake, S3, or GCS on a schedule — or under an enterprise license with custom windows? We set up direct cloud delivery for enterprise customers.
Pro-forma invoicing and bank transfer available for institutional buyers.
About this dataset
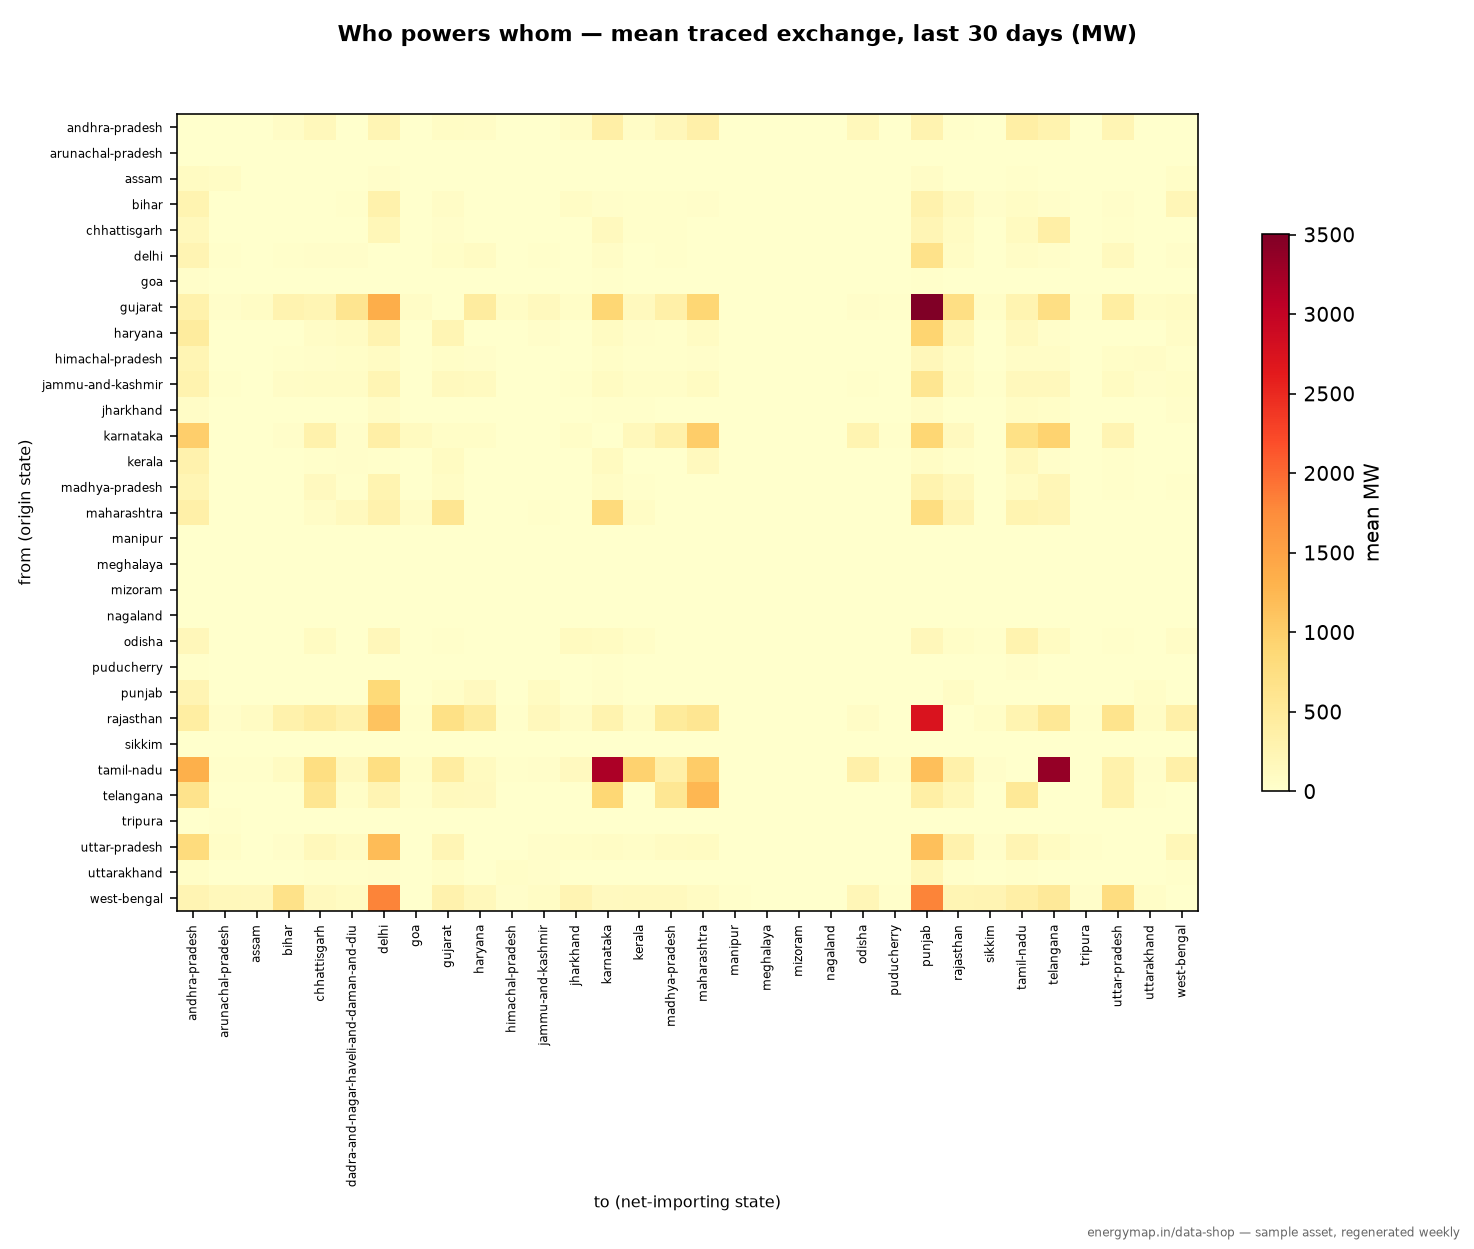
India publishes each state's NET interchange — but never who traded with whom. This dataset reconstructs the missing matrix: for every hour and every net-importing state, the MW (and share) sourced from each exporting state.
Method (three stages, peer-reviewed lineage). Per-state net interchange from our SLDC/NLDC collection stack is (1) closed to a consistent hourly balance, (2) routed over the India Grid Graph's state-reduced transmission network with a DC power flow (the corridor inventory: 463 inter-state EHV circuits aggregated into 63 corridors), and (3) attributed origin-to-destination with proportional-sharing flow tracing — the same technique behind Electricity Maps' European consumption accounting (Bialek 1996; Tranberg et al. 2019). Full methodology in our flow-tracing white paper.
Three files per export: the exchange matrix, the solved corridor flows (with thermal-loading %), and a per-hour quality ledger (closure imbalance, input source mix, consistency residuals) so you can filter to the fidelity your use case needs.
Built for trading desks (import-dependence and counterparty exposure), transmission and RE developers (corridor utilisation), and policy research (transit flows, seasonal reversals).
Not suitable for consumption-based carbon accounting. Rows attribute each state's NET IMPORT by origin state and carry no technology dimension, so a consumption mix cannot be derived from them.
Coverage — measured, not promised
Hourly from 22 Jan 2026 (first hourly-native interchange rows) to the present, refreshed hourly with a 26-hour rebuild window. **Hourly coverage is currently degraded and varies substantially: 67% of hours over the last 30 days, and as low as 2 hours per day since 3 Aug 2026.** An hour is built only when at least 25 states report a bilateral-net position, and that threshold is presently met almost entirely through a carry-forward tier rather than fresh modelled or measured input. Check the per-hour ledger for the exact hours and input mix in any window before purchase; configure a date range accordingly. 32 states/UTs — island grids and Chandigarh have no inter-state corridors and are excluded.
| state_exchange_matrix_hourly | |||||||||
|---|---|---|---|---|---|---|---|---|---|
| state_corridor_flows_hourly | |||||||||
| state_exchange_run_hours | |||||||||
| 2026-01 | 2026-02 | 2026-03 | 2026-04 | 2026-05 | 2026-06 | 2026-07 | 2026-08 | 2026-09 |
Known holes — disclosed, never hidden
- state_exchange_matrix_hourly
- 3,00,712 rows
- 2026-01-22 – 2026-09-28
- state_corridor_flows_hourly
- 2,43,093 rows
- 2026-01-22 – 2026-09-28
- state_exchange_run_hours
- 4,063 rows
- 2026-01-22 – 2026-09-28
Coverage stats generated 2026-09-28 by the weekly sample-assets pipeline · 5,47,868 total rows
Data dictionary
| Column | Type | Description |
|---|---|---|
| timestamp | timestamptz | Hour, UTC |
| from_state | text | Origin state slug (net exporter that hour) |
| to_state | text | Destination state slug (net importer that hour) |
| mw | float | Flow-traced MW of from_state-origin power serving to_state's net import this hour. NET-injection semantics: rows attribute each state's net import; a net-exporting state has no to_state rows |
| share | float | Fraction of to_state's net import sourced from from_state (0-1) |
| method | text | Model revision label, e.g. dcpf_bialek_v1 |
| Column | Type | Description |
|---|---|---|
| timestamp | timestamptz | Hour, UTC |
| state_a | text | First state of the corridor pair (sorted ascending) |
| state_b | text | Second state of the corridor pair |
| flow_mw | float | DC-power-flow corridor flow, MW; positive = state_a → state_b |
| rating_mva | float | Summed thermal rating of the corridor's circuits |
| loading_pct | float | |flow| / rating × 100 |
| hvdc_equivalent | bool | TRUE where the corridor includes HVDC links folded in with a p_nom-proportional susceptance proxy (set-points are not public) |
| method | text | Model revision label |
| Column | Type | Description |
|---|---|---|
| timestamp | timestamptz | Hour, UTC |
| method | text | Model revision label |
| n_states | int | States entering the solve this hour |
| closure_imbalance_mw | float | Pre-closure sum of state nets. Zero for perfectly consistent inputs; large values flag hours dominated by the modeled input tier |
| closure_adjustment_l1_mw | float | Total |adjustment| applied to close the hour |
| gross_abs_mw | float | Sum of |net| across states — the denominator for an imbalance ratio; filter on closure_adjustment_l1_mw / gross_abs_mw for quality |
| max_sum_q_residual | float | Tracing consistency: max |1 − Σ share| across importers |
| corridors_over_rating | int | Corridors solved above thermal rating (input-error flag) |
| mean_input_confidence | float | Mean confidence of the input net-interchange rows |
| input_source_mix | json | {source: n_states} of the hour's input rows |
Caveats — read before you buy
- Model estimates, not metered flows. India publishes no bilateral state-to-state measurements at any resolution; this matrix is a physically-constrained reconstruction (DC power flow + proportional-sharing tracing) and is labelled with its model revision (`method` column).
- Net-injection semantics. Rows attribute each state's net import to origin states. A state's own generation serving its own load is out of scope; net exporters have no import rows.
- Input quality varies by hour. Only 4-6 states have metered SLDC interchange today; the rest are model-based. The run ledger carries closure imbalance and source mix per hour — filter on closure_adjustment_l1_mw / gross_abs_mw for high-fidelity subsets.
- HVDC simplification. HVDC links are folded into the corridor graph with a capacity-proportional susceptance proxy (set-points are not public); affected corridors are flagged hvdc_equivalent.
- Intra-state congestion is invisible at state-zonal resolution; not suitable for security/operational studies.
- No directional skill is claimed. Aggregated to the seven published inter-regional corridors, the reconstruction agrees on flow direction for 95.3% of energy — but a baseline using the previous day's published sign attains 98.9%, so the model does not improve on persistence. Use the corridor aggregates as a consistency check, not as evidence of directional accuracy.
- State-pair values are a convention, not a measurement. India publishes seven corridor aggregates against 31 independent zonal degrees of freedom; the sensitivity matrix has rank 7, so 24 dimensions are unobservable from the published physical-flow record. Testing zone contrasts directly, 22 of 496 zone pairs are observationally indistinguishable — all 21 North-Eastern pairs, plus Jammu and Kashmir vs Punjab. Remaining Northern pairs are formally distinguishable but only at 0.2-1.3% of the largest contrast.
- Uncertainty is calibrated at corridor level, not per cell. The published envelope covers ~97% of corridor aggregates against the measured record; no coverage claim is made or testable for an individual state pair, because no state pair is ever observed.
License & citation
Commercial
Cite as: India Energy Atlas (energymap.in) flow-traced model estimates, computed from SLDC/NLDC net-interchange measurements and the India Grid Graph transmission model
Frequently asked
What exactly do I get when I buy State-to-State Power Exchange Matrix, Hourly (Flow-Traced)?
A one-time export built fresh from the live India Energy Atlas database at purchase time, delivered as csv_gz via a private tokened download link, with a per-state/per-month coverage report and a data dictionary included. Hourly from 22 Jan 2026 (first hourly-native interchange rows) to the present, refreshed hourly with a 26-hour rebuild window. **Hourly coverage is currently degraded and varies substantially: 67% of hours over the last 30 days, and as low as 2 hours per day since 3 Aug 2026.** An hour is built only when at least 25 states report a bilateral-net position, and that threshold is presently met almost entirely through a carry-forward tier rather than fresh modelled or measured input. Check the per-hour ledger for the exact hours and input mix in any window before purchase; configure a date range accordingly. 32 states/UTs — island grids and Chandigarh have no inter-state corridors and are excluded.
How is this licensed?
Commercial license for single-organization internal use. Attribution: India Energy Atlas (energymap.in) flow-traced model estimates, computed from SLDC/NLDC net-interchange measurements and the India Grid Graph transmission model. Redistribution or resale of the raw series is not permitted.
How fresh is the data and how are gaps handled?
The catalog shows live freshness straight from the source tables (15-minute server cache). Exports are built at purchase time, and every known multi-day gap is disclosed in the coverage report on this page — we never sell around a hole silently.
Can I configure the date range and states?
Yes — the configurator lets you pick the time window, states and format before checkout, and the price scales with the window you pick.
Do you offer pro-forma invoices or bank transfer?
Yes. Institutional buyers can request a pro-forma invoice and pay by bank transfer; the order unlocks automatically once payment is marked received. Stripe checkout (cards/UPI) is available for self-serve purchases.
Buyers also explored
Power Supply Position, Daily (Grid-India Archive)
from ₹2,499
2021-04 – 2026-10
View and buy
State Shortage & Deficit, Monthly
from ₹2,499
2021-04 – 2026-10
View and buy
All-India Grid Frequency, 15-Minute Blocks
from ₹2,499
2022-12 – 2026-10
View and buy
← All datasets·Source: India Energy Atlas · api.energymap.in · coverage and samples regenerated weekly