
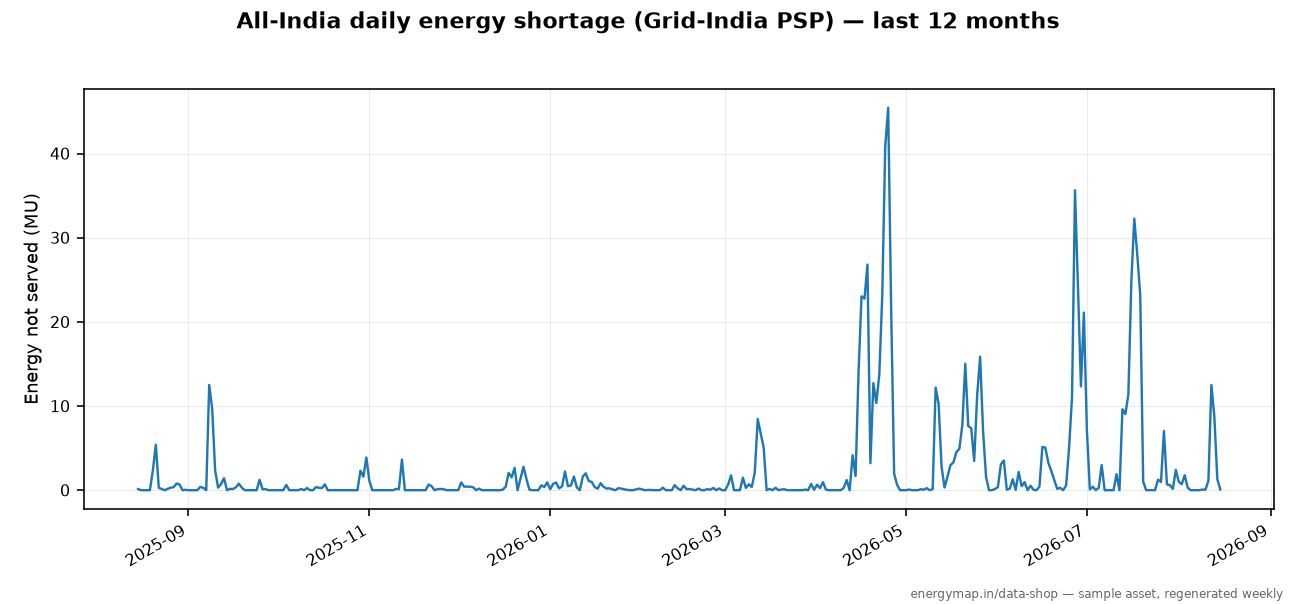
About this dataset
- ·Covers 2021-04-01 – 2026-10-01
- ·2K rows
- ·Resolution: monthly
- ·All 33 Grid-India PSP reporting entities — subset at checkout
- ·Exports built fresh from the live database at purchase time
- ·Coverage report with every known gap disclosed (below)
₹2,499
Leave empty for all currently covered states. A subset is priced pro-rata (min 40%).
Enter your email above to check out as a guest, or continue to create a free account (purchases saved in My Products). Card payments via Stripe; pro-forma/bank transfer for institutions.
Sold by India Energy Atlas · CC-BY license · cite: India Energy Atlas (energymap.in), CC BY 4.0
Enterprise delivery
Need this landing in Snowflake, S3, or GCS on a schedule — or under an enterprise license with custom windows? We set up direct cloud delivery for enterprise customers.
Pro-forma invoicing and bank transfer available for institutional buyers.
About this dataset
The month-by-month record of Indian electricity shortage, per state, from Apr 2021 to the present — rolled up from Grid-India's (POSOCO) daily Power Supply Position reports.
Each row carries the energy not served (MU), the energy deficit percentage on the CEA convention, and the month's peak shortage and peak demand. The deficit percentage is the metric to reach for: it is robust to the handful of days Grid-India does not publish, which a raw MU sum silently under-counts.
Why this is not just the daily archive grouped by month. The `state` column in the raw PSP feed is an upstream label, not a key, and grouping on it is wrong in three ways. Non-states sit in it (DVC is a generating utility; Railways and bulk consumers are ISTS-connected loads). Grid-India renames entities mid-panel — it relabelled HP, MP and UP to their full names on 16 Jun 2026, and merged Dadra & Nagar Haveli with Daman & Diu in Jun 2022 — so a naive grouping splits one state into two truncated series. This product resolves every label to a canonical entity first, and fails its build rather than drop a label it does not recognise.
Every row also travels with `days_reported` and `coverage_pct`, so an incomplete month — including a partial month at the edge of your chosen window — is visible in the data rather than hidden in the total.
Coverage — measured, not promised
Apr 2021 to present, monthly, ~2-day NLDC publish lag on the underlying daily feed. 33 reporting entities. Apr 2021 is partial (the daily series starts on the 24th) and the current month is partial by definition; both are disclosed per-row in coverage_pct.
| state_shortage_monthly | ||||||||||||||||||||||||||||||||||||||||||||||||||||||||||||||||||
|---|---|---|---|---|---|---|---|---|---|---|---|---|---|---|---|---|---|---|---|---|---|---|---|---|---|---|---|---|---|---|---|---|---|---|---|---|---|---|---|---|---|---|---|---|---|---|---|---|---|---|---|---|---|---|---|---|---|---|---|---|---|---|---|---|---|---|
| 2021-04 | 2021-09 | 2022-02 | 2022-07 | 2022-12 | 2023-05 | 2023-10 | 2024-03 | 2024-08 | 2025-01 | 2025-06 | 2025-11 | 2026-04 | 2026-09 |
Known holes — disclosed, never hidden
- state_shortage_monthly
- 2,178 rows
- 2021-04-24 – 2026-09-27
Coverage stats generated 2026-09-28 by the weekly sample-assets pipeline · 2,178 total rows
Data dictionary
| Column | Type | Description |
|---|---|---|
| month | text | Calendar month, IST (YYYY-MM) |
| state | text | State slug, e.g. rajasthan |
| state_code | text | Canonical entity code, e.g. RJ. JK_LA = the combined J&K + Ladakh area |
| state_name | text | Canonical entity name |
| days_reported | int | Days in the month Grid-India published a PSP row for this state |
| days_in_month | int | Calendar days in the month |
| coverage_pct | float | 100 x days_reported / days_in_month; < 100 means an incomplete month |
| energy_shortage_mu | float | Energy not served, million units, summed over the month. A SUM, so it under-counts when coverage_pct < 100 — prefer energy_shortage_pct to compare across months |
| energy_met_mu | float | Energy met, million units, summed over the month |
| energy_shortage_pct | float | Energy deficit %: 100 x shortage / (met + shortage). CEA convention, robust to reporting gaps. The recommended headline metric |
| peak_shortage_mw_max | float | Largest daily coincident peak shortage in the month, MW. Grid-India's peak shortage is the shortage AT the instant of the demand peak, not the worst shortage of the day: ~9% of state-days carry real energy shortage with a peak shortage of 0 (load shed off-peak). Never read 0 here as 'no shortage' |
| peak_shortage_mw_mean | float | Mean of the month's daily coincident peak shortages, MW |
| peak_demand_mw_max | float | Largest single-day peak demand in the month, MW |
Caveats — read before you buy
- 33 entities, not 36. J&K and Ladakh are reported by Grid-India as one combined control area (`JK_LA`). Andaman & Nicobar and Lakshadweep are isolated island grids and never appear in the all-India PSP feed.
- Peak shortage is coincident with the demand peak, not the worst shortage of the day. ~9% of state-days show real energy shortage against a peak shortage of 0 — load shed off-peak. Use energy_shortage_mu / energy_shortage_pct to answer 'was there a shortage'.
- energy_shortage_mu is a sum and under-counts any month where coverage_pct < 100. Use energy_shortage_pct for cross-month comparison.
- Partial months at the edges of a custom window are aggregated from the days inside the window only; coverage_pct discloses this per row.
- Publishes T+2 (NLDC lag); the freshest two days are absent by design.
License & citation
CC-BY
Cite as: India Energy Atlas (energymap.in), CC BY 4.0
Frequently asked
What exactly do I get when I buy State Shortage & Deficit, Monthly?
A one-time export built fresh from the live India Energy Atlas database at purchase time, delivered as csv_gz, xlsx via a private tokened download link, with a per-state/per-month coverage report and a data dictionary included. Apr 2021 to present, monthly, ~2-day NLDC publish lag on the underlying daily feed. 33 reporting entities. Apr 2021 is partial (the daily series starts on the 24th) and the current month is partial by definition; both are disclosed per-row in coverage_pct.
How is this licensed?
CC BY 4.0 — use it anywhere, including published work, with attribution: "India Energy Atlas (energymap.in), CC BY 4.0".
How fresh is the data and how are gaps handled?
The catalog shows live freshness straight from the source tables (15-minute server cache). Exports are built at purchase time, and every known multi-day gap is disclosed in the coverage report on this page — we never sell around a hole silently.
Can I configure the date range and states?
Yes — the configurator lets you pick the time window, states and format before checkout, and the price scales with the window you pick.
Do you offer pro-forma invoices or bank transfer?
Yes. Institutional buyers can request a pro-forma invoice and pay by bank transfer; the order unlocks automatically once payment is marked received. Stripe checkout (cards/UPI) is available for self-serve purchases.
Buyers also explored
Power Supply Position, Daily (Grid-India Archive)
from ₹2,499
2021-04 – 2026-10
View and buy
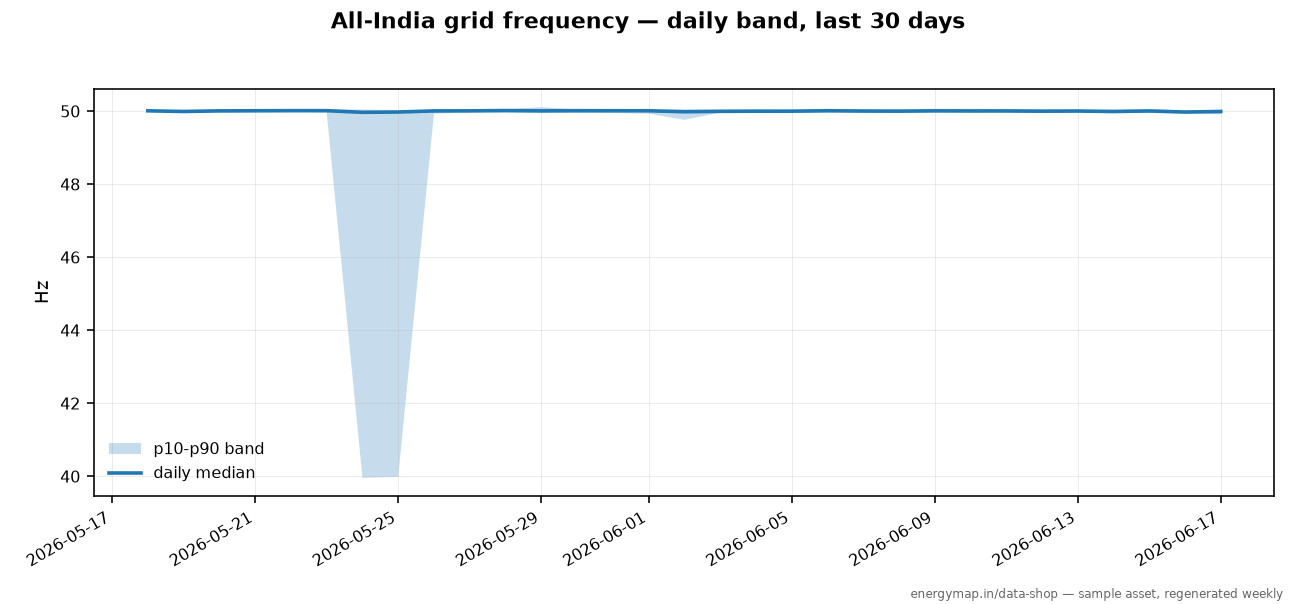
All-India Grid Frequency, 15-Minute Blocks
from ₹2,499
2022-12 – 2026-10
View and buy
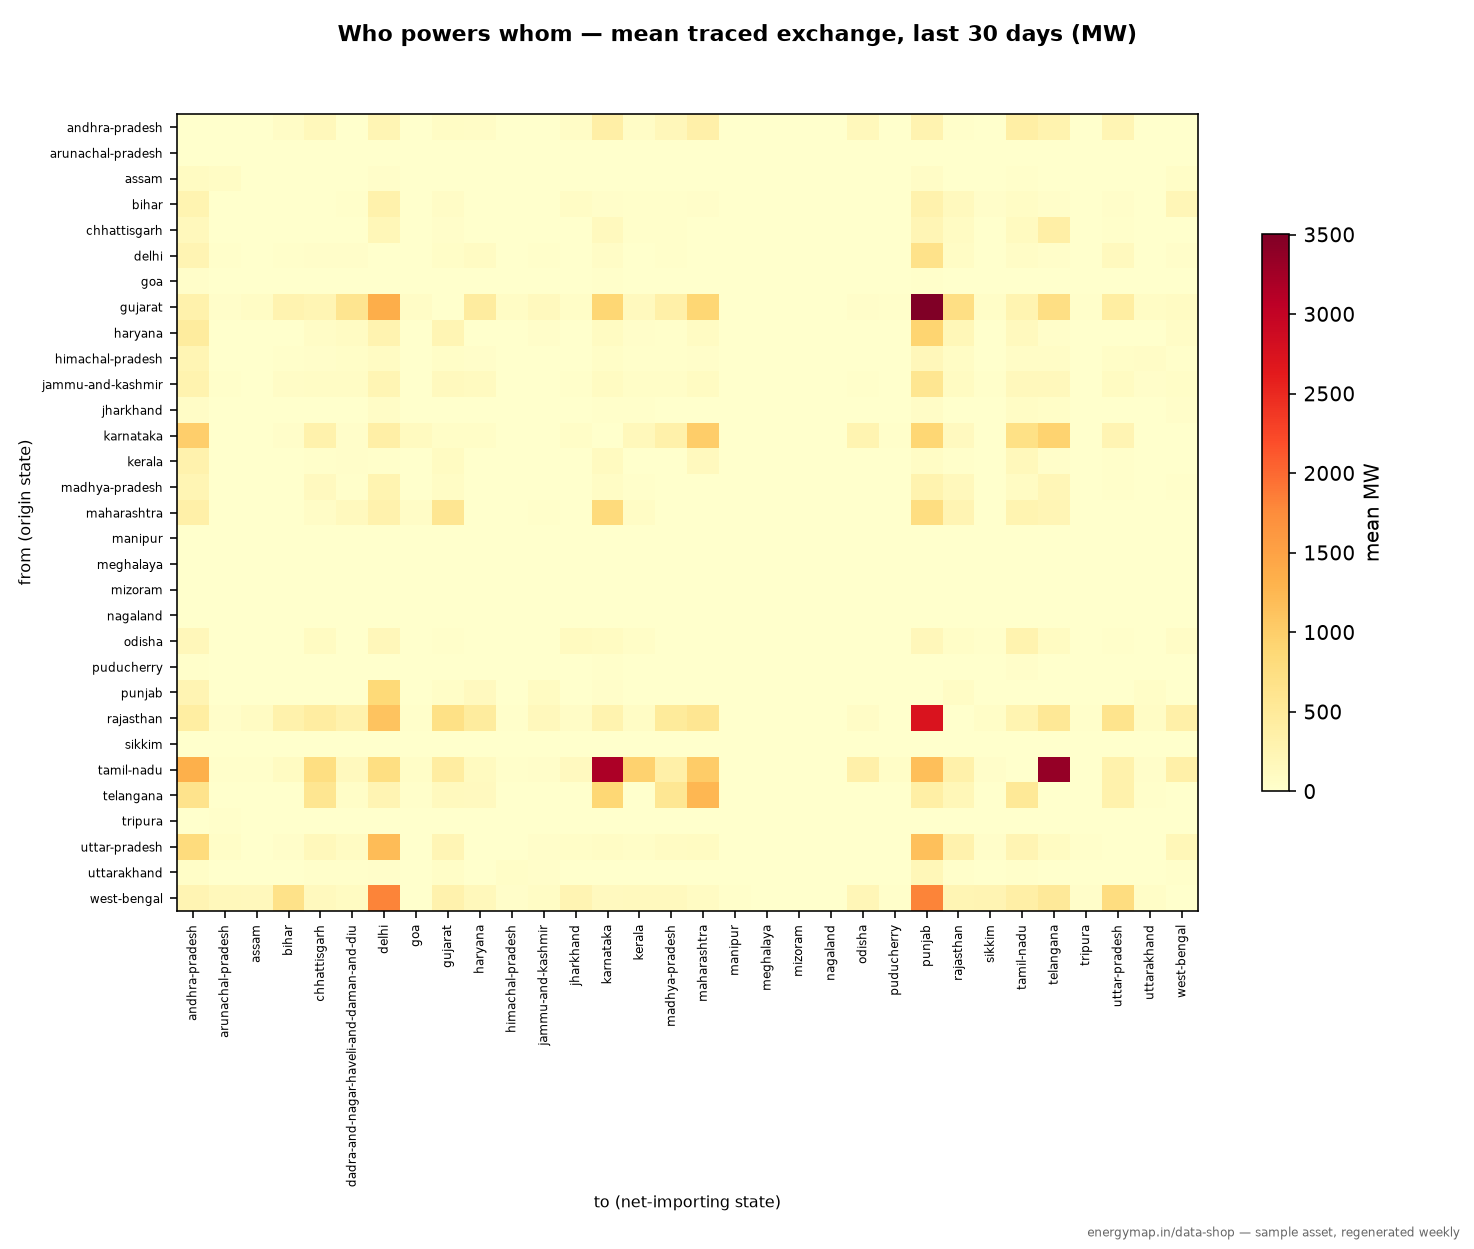
State-to-State Power Exchange Matrix, Hourly (Flow-Traced)
from ₹2,499
2026-01 – 2026-10
View and buy
← All datasets·Source: India Energy Atlas · api.energymap.in · coverage and samples regenerated weekly