
Forecast comparison and source documentation
This page documents operational IT capacity, facility power input, annual electricity use, and grid-planning load. It provides the definitions, calculations, and dated sources used in the Review.
Classification by measure, horizon, cutoff date, and baseline
Each estimate is classified by measure, forecast horizon, evidence cutoff date, and baseline year. These fields are required for comparison.
| Source | Cutoff | Value | Horizon | Measure | Interpretation |
|---|---|---|---|---|---|
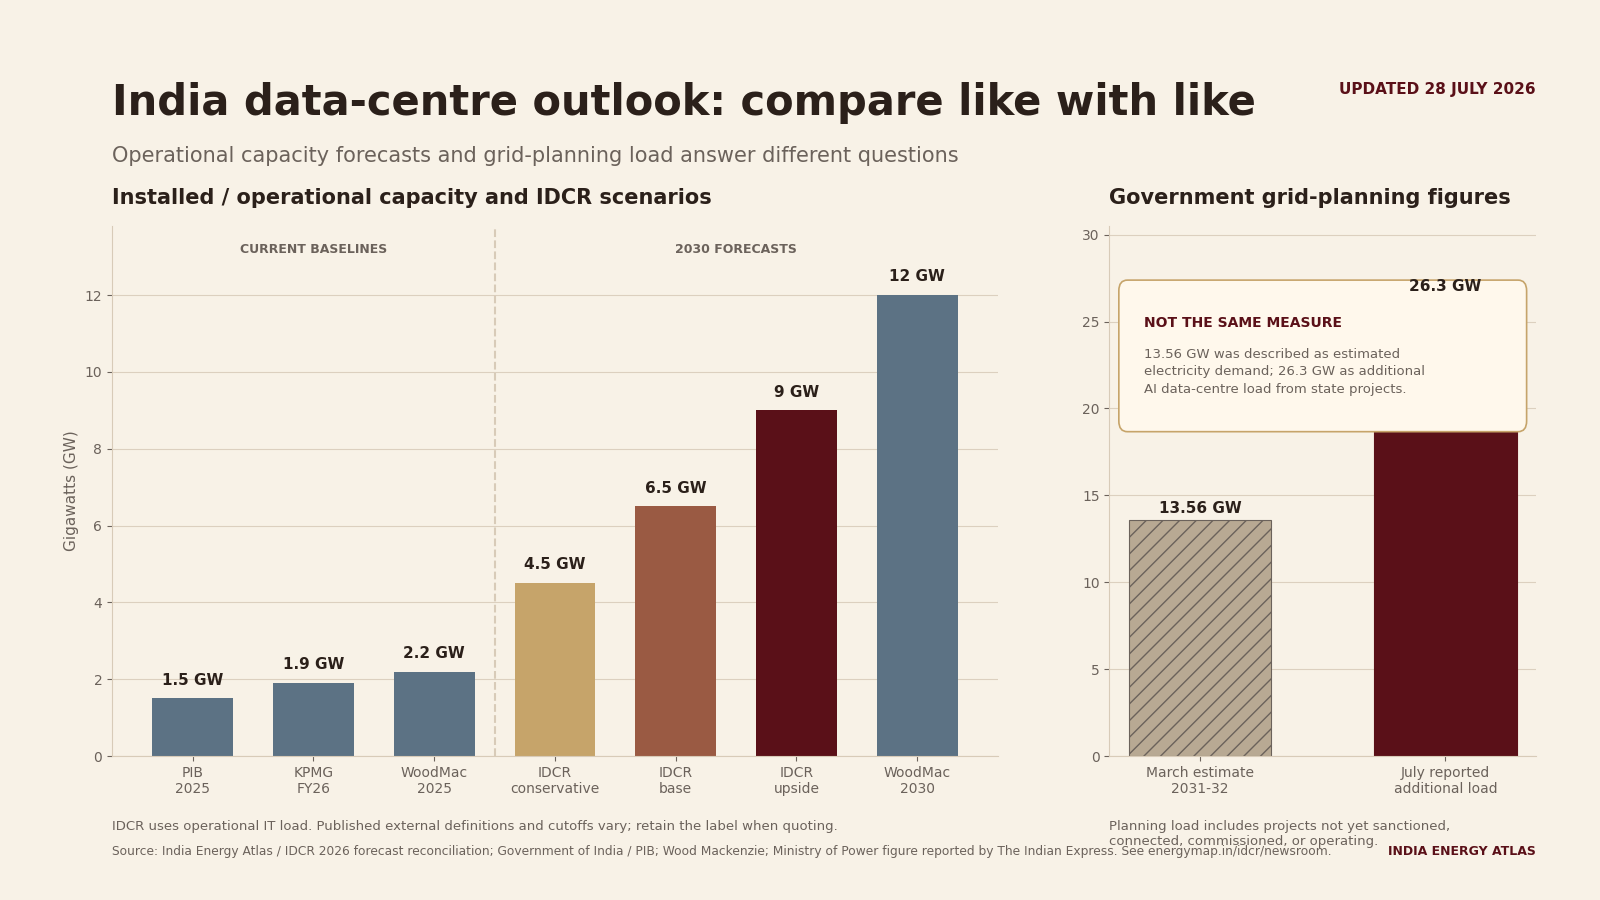
| Government / PIB | 13 Mar 2026 | 1.5 GW | 2025 | Installed/operational data-centre capacity | Public baseline used by IDCR for scenario arithmetic. |
| KPMG in India | Jul 2026 | ~1.9 GW | FY26 | Installed data-centre capacity | Later fiscal-year market estimate with a separate cutoff from the PIB baseline. |
| IDCR 2026 | 28 Jul 2026 | 4.5 / 6.5 / 9.0 GW | 2030 | Operational IT load, scenario range | Conservative, probability-weighted base, and upside cases. |
| Wood Mackenzie | 27 Jul 2026 | 12 GW | 2030 | Operational data-centre capacity | Independent high-growth forecast from a 2.2 GW 2025 baseline. |
| Ministry of Power | 27 Jul 2026 report | +26.3 GW | FY2031-32 | Additional AI data-centre grid load from projects received by states | Grid-planning estimate. Operational IT capacity requires separate conversion assumptions. |
IDCR and Wood Mackenzie 2030 forecasts
The IDCR base case is 45.8% below Wood Mackenzie's 12 GW operational-capacity forecast. The IDCR upside case is 25% below that forecast. The IDCR upside CAGR is 43.1% from a 1.5 GW baseline. Wood Mackenzie reports approximately 40% from a 2.2 GW baseline.
The 26.3 GW figure is an additional-load planning estimate for FY2031-32 based on projects received by states. Comparison with operational capacity requires project-level information on duplication, sanction, construction, connection, commissioning, PUE, and utilisation.
IDCR scenario assumptions
| Scenario | Operational IT | Facility input | Annual energy | 2025–30 CAGR |
|---|---|---|---|---|
| Conservative | 4.5 GW | 6.1 GW | 45 TWh | 24.6% |
| Base | 6.5 GW | 8.8 GW | 65 TWh | 34.1% |
| Upside | 9 GW | 12.2 GW | 90 TWh | 43.1% |
Data, charts, methodology, and citation guidance
The files are available without registration. Reuse should retain the source line and identify any changes to charts or calculations.
India Energy Atlas Research Team. “India Data Centre Review 2026: 28 July Forecast Reconciliation Edition.” India Energy Atlas, 28 July 2026. https://www.energymap.in/idcr
For a chart or data extract, add: “Forecast reconciliation dataset, updated 28 July 2026.”
Requests for source and calculation verification
Dr. Deepali Jain, Director, India Energy Atlas, is the media contact for this edition. Requests should include the publication, deadline, and figure under review. Responses will identify the published evidence and India Energy Atlas analysis.