Outlook and Strategic Recommendations
The three investment decisions that will define India's data centre landscape through 2030 — and the strategic questions each stakeholder class needs to answer.
India's data centre industry stands at the threshold of a decisive decade. Demand is strong, capital is available, and policy intent is clear. The binding constraint is execution: building power, water, cooling, and governance infrastructure at the speed the market requires. This chapter presents three scenarios for 2030 and offers stakeholder-specific recommendations.
Atlas live indicators framing the 2030 path: peak demand · grid carbon intensity · day-ahead price . Cross-link to /forecast · /energy-security · /data-centres · /developer.
Three Scenarios for 2030: What Must Be True for Each to Materialise
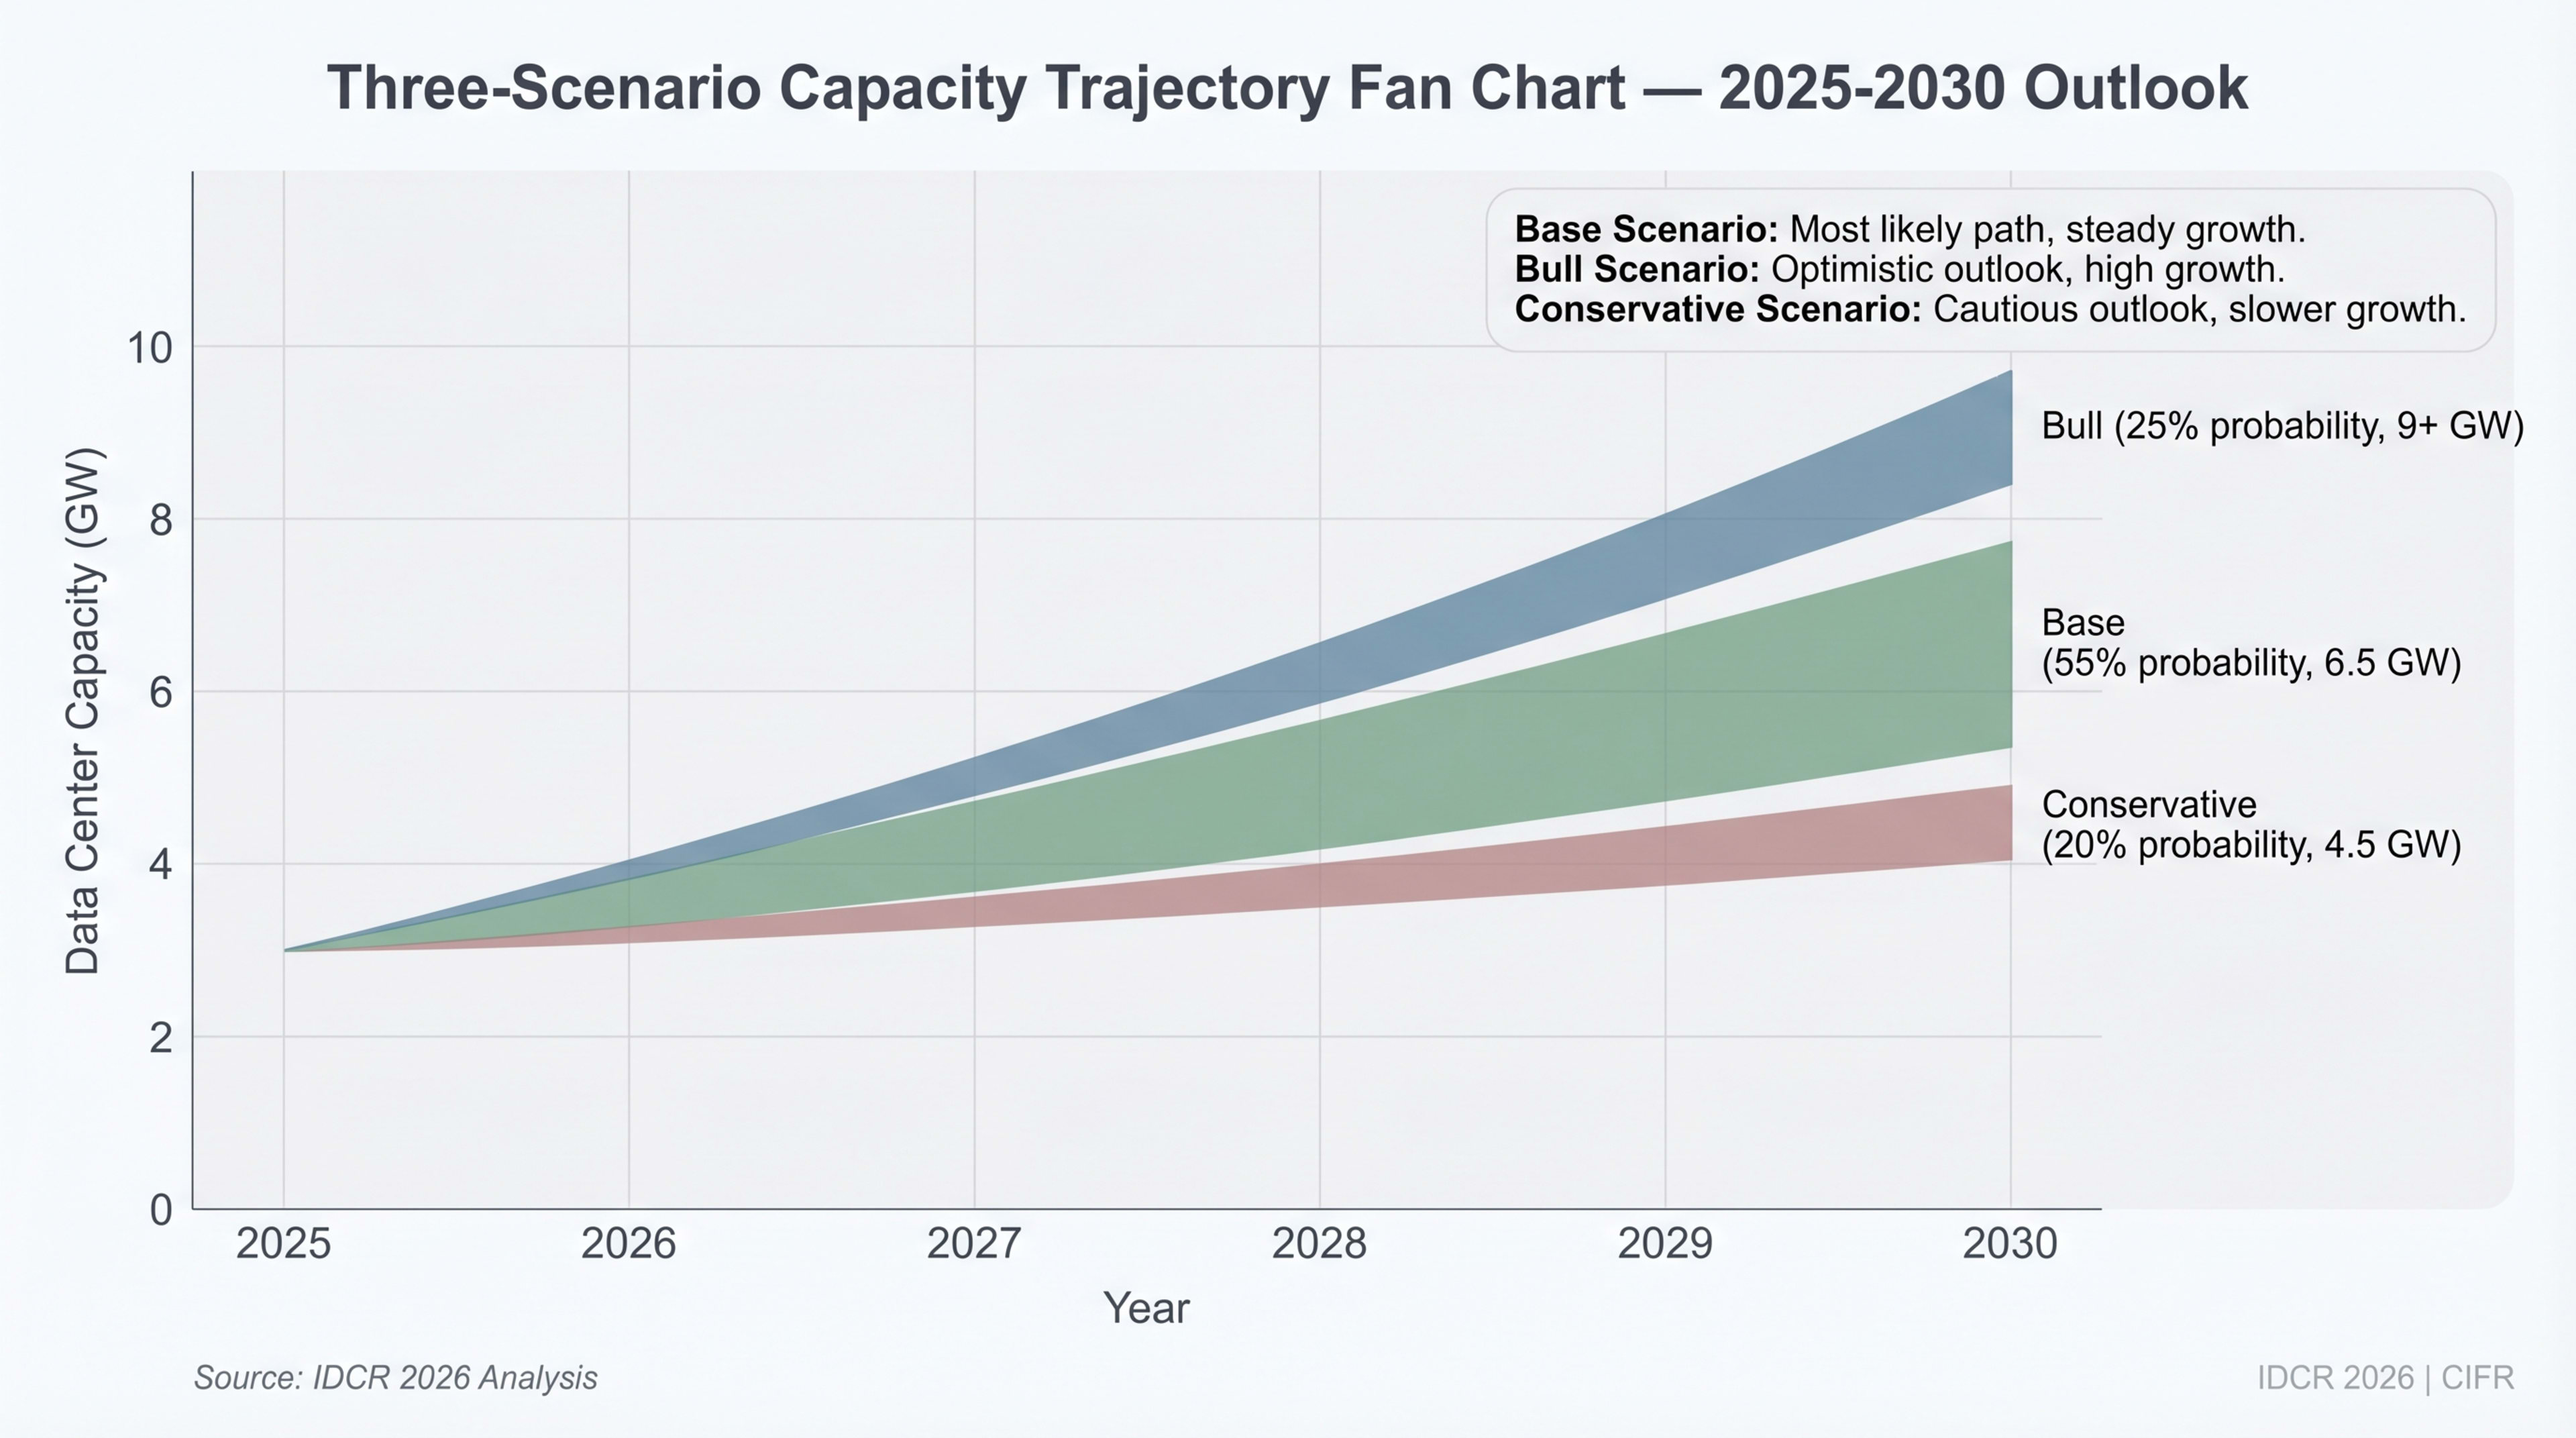
| Parameter | Conservative (4.5 GW) | Base Case (6.5 GW) | Bull Case (9+ GW) |
|---|---|---|---|
| Capacity (2030) | 4,500 MW | 6,500 MW | 9,000–9,200 MW |
| Power assumption | Grid bottlenecks persist; 36+ month interconnection queues remain; no dedicated DC feeder programme | Moderate grid upgrades; 18-month interconnection target met in 3 of 7 markets; select 220 kV substations fast-tracked | National DC feeder programme launched; interconnection queues reduced to 12 months; captive RE + battery at scale |
| AI adoption | AI demand plateaus after initial wave; enterprise adoption slower than projected | Steady AI growth; IndiaAI scales to 58K GPUs; 2-3 large sovereign AI clusters operational | AI demand accelerates; India captures regional AI training workloads; 100K+ GPUs deployed |
| Policy execution | National DC policy delayed; state incentives fragmented; 30+ approvals persist | National policy enacted; single-window clearance in 5+ states; DCEZ pilot operational | Full national policy with enforcement; standardised incentives; DC REIT framework |
| Investment required | $20–25B cumulative | $30–40B cumulative | $45–55B cumulative |
| Probability | 20% | 55% | 25% |
Source: Council for Independent Frontier Research (CIFR) scenario analysis. Base case aligns with CBRE/JLL projections; bull case with Nomura (9.2 GW); conservative case with Colliers (4.5 GW)
CIFR ESTIMATE This Review assigns 55% probability to the base case (6.5 GW by 2030, 4.3x growth from 1,500 MW). Required investment: $30--40 billion cumulative; approximately half is already committed or under construction. The binding constraint is power grid delivery speed and regulatory execution, not capital. Every 6-month interconnection delay removes 200--300 MW from the 2030 pipeline.
Geopolitical Tailwind: The March 2026 Inflection
This Review is published during severe global digital infrastructure disruption. The Strait of Hormuz and Red Sea closures, military strikes on hyperscale facilities (AWS UAE/Bahrain, 1 March 2026), and force majeure declarations by LNG suppliers have redrawn the risk map for data-centre investment. These events postdate most chapter edits; this section provides overlay.
India faces asymmetrically positive impact. The $33.8 billion MENA data-centre investment planned through 2030 (PwC) now competes against war-risk premiums absent at 2026 start. Lloyd's Joint War Committee redesignated the Arabian Gulf as a conflict zone (3 March 2026); insurance premiums surged over 1,000% for maritime and infrastructure risks (S&P Global; Insurance Journal, March 2026). AWS advised customers to migrate from the Middle East (CBS News, March 2026). India --- $45.2 billion in confirmed hyperscaler commitments, democratic governance, no proximate conflict, world's second-largest internet base --- is the natural beneficiary.
The flight-to-stability thesis is materialising. Capacity Media (10 March 2026) reported a potential "data-centre exodus to India." The OpenAI-Tata partnership (100 MW initial, option to 1 GW; February 2026) signals frontier AI companies choosing India for sovereign compute. Deloitte projects $200 billion Indian data-centre investment by 2030 (Business Standard, 19 February 2026).
The presented scenarios (conservative 4.5 GW, base 6.5 GW, bull 9+ GW) were developed before the March crisis. The geopolitical tailwind does not alter fundamental supply constraints (power, water, approvals) gating India's build-out. It accelerates capital availability and increases bull-case probability. If sustained Gulf instability redirects 10--15% of planned MENA investment toward India, this represents $3--5 billion additional capital flows, funding 500--700 MW at India's $5--7M/MW construction cost. Revised probability weights: conservative 15% (from 20%), base 50% (from 55%), bull 35% (from 25%).
Source: IDCR 2026 analysis.
The Three Structural Shifts That Reframe the 2030 Outlook
Three structural shifts have crystallised in the past 12 months that the 2030 base case did not anticipate:
- Data centres are becoming utilities. In April 2026, Andhra Pradesh granted Google a power-distribution licence — the first private discom licence to a non-utility in the state — for the 1 GW Visakhapatnam campus (Varindia· VarindiaApr 2026; Google Press Corner· GoogleApr 2026). The state's parallel framework allowing DCs themselves to apply for distribution licences (Whalesbook· Whalesbook) signals a replicable model. Telangana and Karnataka are watching; Maharashtra's 18-month MSEDCL queue makes the political-economy case unavoidable. By 2030, the largest 5–10 hyperscale campuses in India will operate with utility-class regulatory status — not DISCOM customers. This compresses tariff arbitrage between states and shifts the competitive variable from incentives to the legal-framework speed of granting licences. Live Andhra Pradesh grid context.
- Carbon becomes a priced opex line by FY28. India's CCTS goes live in H2 2026 with 740 obligated entities and >700 MtCO₂e initial coverage (ICAP· ICAP). Article 6.2 bilateral agreements with Japan (signed Aug 2025), Singapore, Sweden, South Korea (in negotiation), plus the Green Hydrogen Certification Scheme integration with CCTS in 2026, create a four-way carbon-pricing stack. By FY28, every >30 MW Indian data centre will face explicit carbon costs in opex — and the operators with verified 24/7 CFE matching, Indian green-hydrogen offtake, or Article 6.2-eligible RE projects will sell into a tightening market while annual-matched-REC operators will buy at rising prices. Live carbon context: /carbon-intensity · /carbon-markets.
- Water utilities become rate-setting counterparties. MWRRA's draft 2026–2029 bulk-water tariff (April 2026), HMWSSB's 870 ML/day projected 2027–28 deficit, and BWSSB's de-facto closed-loop cooling pre-conditions for new connections in DC zones all signal the same shift: water boards are using tariff and allocation — the only levers they have — to slow incremental DC water demand while liquid-cooling technology catches up. By 2030, water-board engagement will be parallel critical-path with DISCOM connection, not downstream civil works (Chapter 8).
These shifts do not invalidate the 6.5 GW base case — they reshape which operators capture it. Hyperscalers with utility-class regulatory status, 24/7 CFE-capable PPA portfolios, and liquid-cooled greenfield builds will compound advantages. Operators relying on DISCOM tariffs, annual-matched RECs, and evaporative cooling will face compressing margins and rising opex through every framework simultaneously. The 2030 winners will be a smaller cohort than today's 39+ operators, with a meaningfully different operating model — closer to vertically integrated power-and-compute companies than to traditional colocation real-estate plays.
Recommendations for Operators: Build for Power Security, Design for Water Neutrality
Keep reading — free, takes 30 seconds
Outlook and Strategic Recommendations continues with 1,078 words and 18 figures.
Free Clerk account. No card. We use it to remember your reading position and unlock subscriber chapters.