
How the Monsoon Reprices India’s Power Market
IEX is a small marginal market with an outsized price signal. A rolling DAM, G-DAM and weather study shows what that signal means for traders and open-access buyers.
The exchange is a marginal market #
India’s power system is organised around long-term contracts, captive supply and regulated distribution. IEX sees the flexible edge that buyers and sellers rebalance through auctions. That edge is small in volume and large in informational value.
The earlier CERC accounting and later monthly update show the collective-exchange share moving across the familiar threshold, using a generation denominator that excludes renewable and captive output. The exhibit carries the comparable observations. IEX is a marginal price laboratory, not a census of India’s electricity supply.
Weather does not reprice every contracted unit. It reprices the residual flexibility reaching the auction, and that marginal signal can influence procurement decisions beyond the cleared volume.
The monsoon changed the shape of risk #
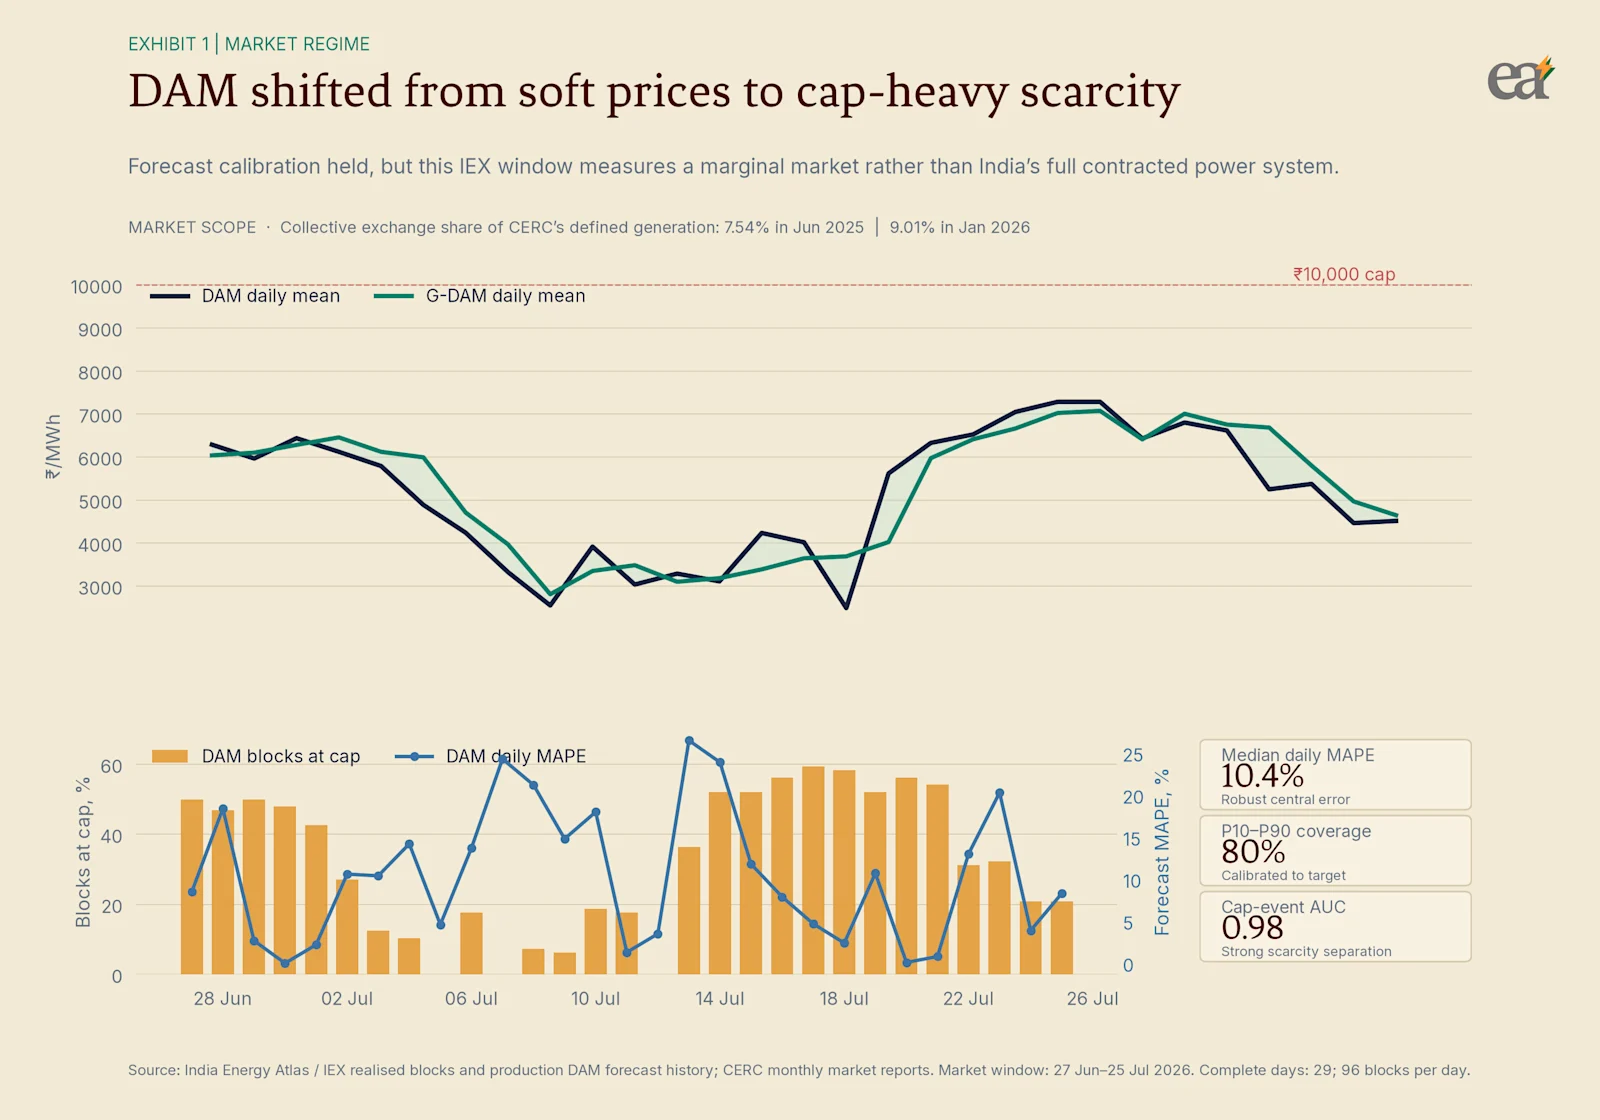
The IMD record of active monsoon conditions and moving low-pressure systems provides the physical backdrop to the recent market window. The realised IEX blocks assembled by India Energy Atlas show a soft opening, concentrated scarcity and partial relief. DAM and G-DAM shared the broad regime while their basis repeatedly changed direction.
Rain can cool demand, suppress solar output, alter hydro expectations and arrive with wind. The auction sees the combined balance after contracts, outages, constraints and portfolio choices have removed most energy from the spot decision.
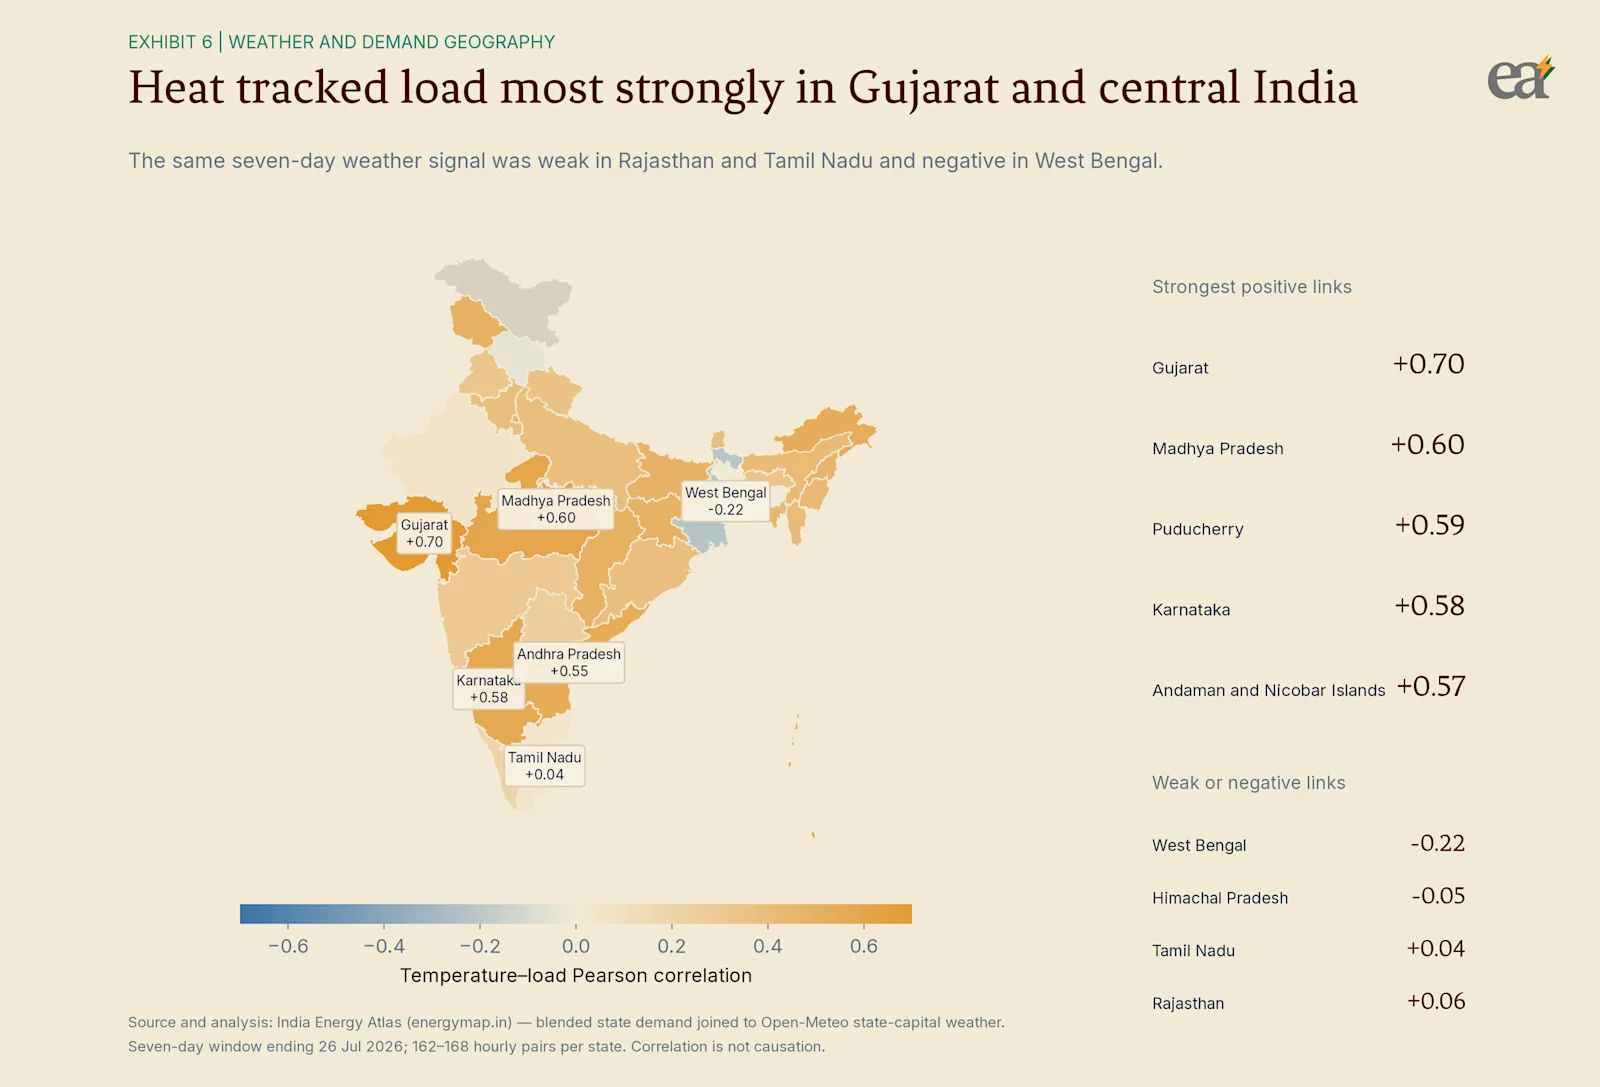
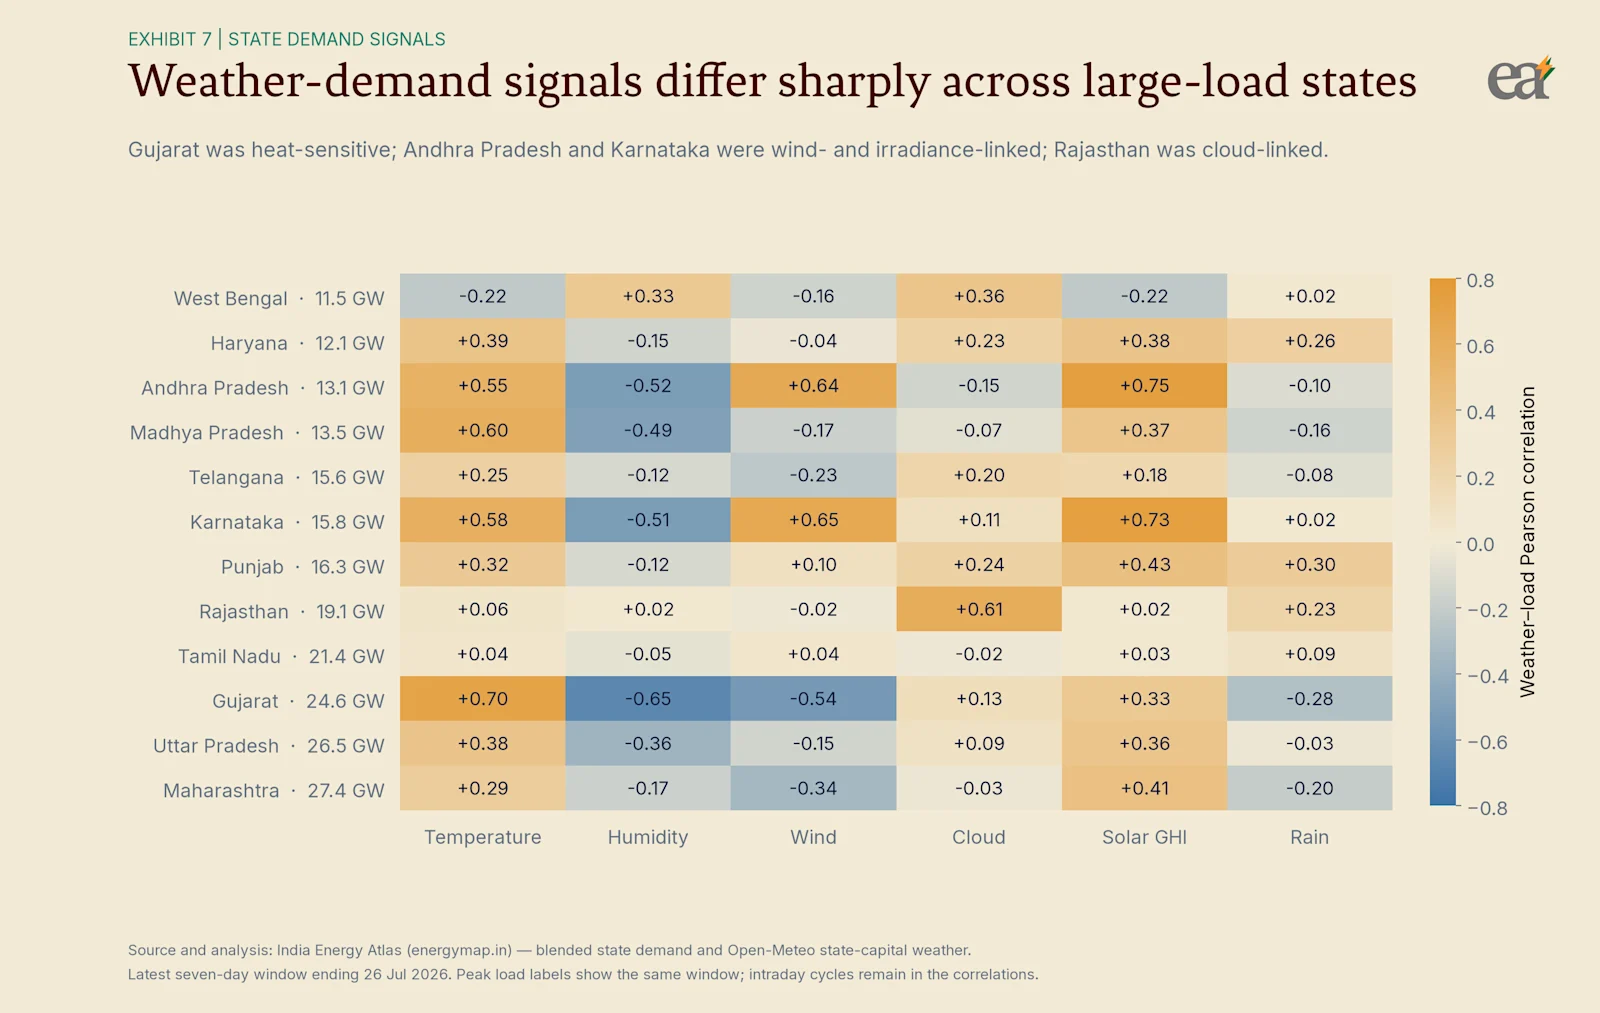
State demand makes that mechanism visible. In the latest India Energy Atlas panel, temperature moved most closely with load in Gujarat and parts of central India; the relationship was weak in Rajasthan and Tamil Nadu and ran the other way in West Bengal. The map screens risk; causal attribution lies beyond this design because each coefficient compresses an intraday cycle, capital-city weather and a blended demand series into one statistic. The heterogeneity still matters. A national demand forecast can be directionally right while the residual buyer reaching DAM sits in a different weather regime.
The delivery hour carries the trade #
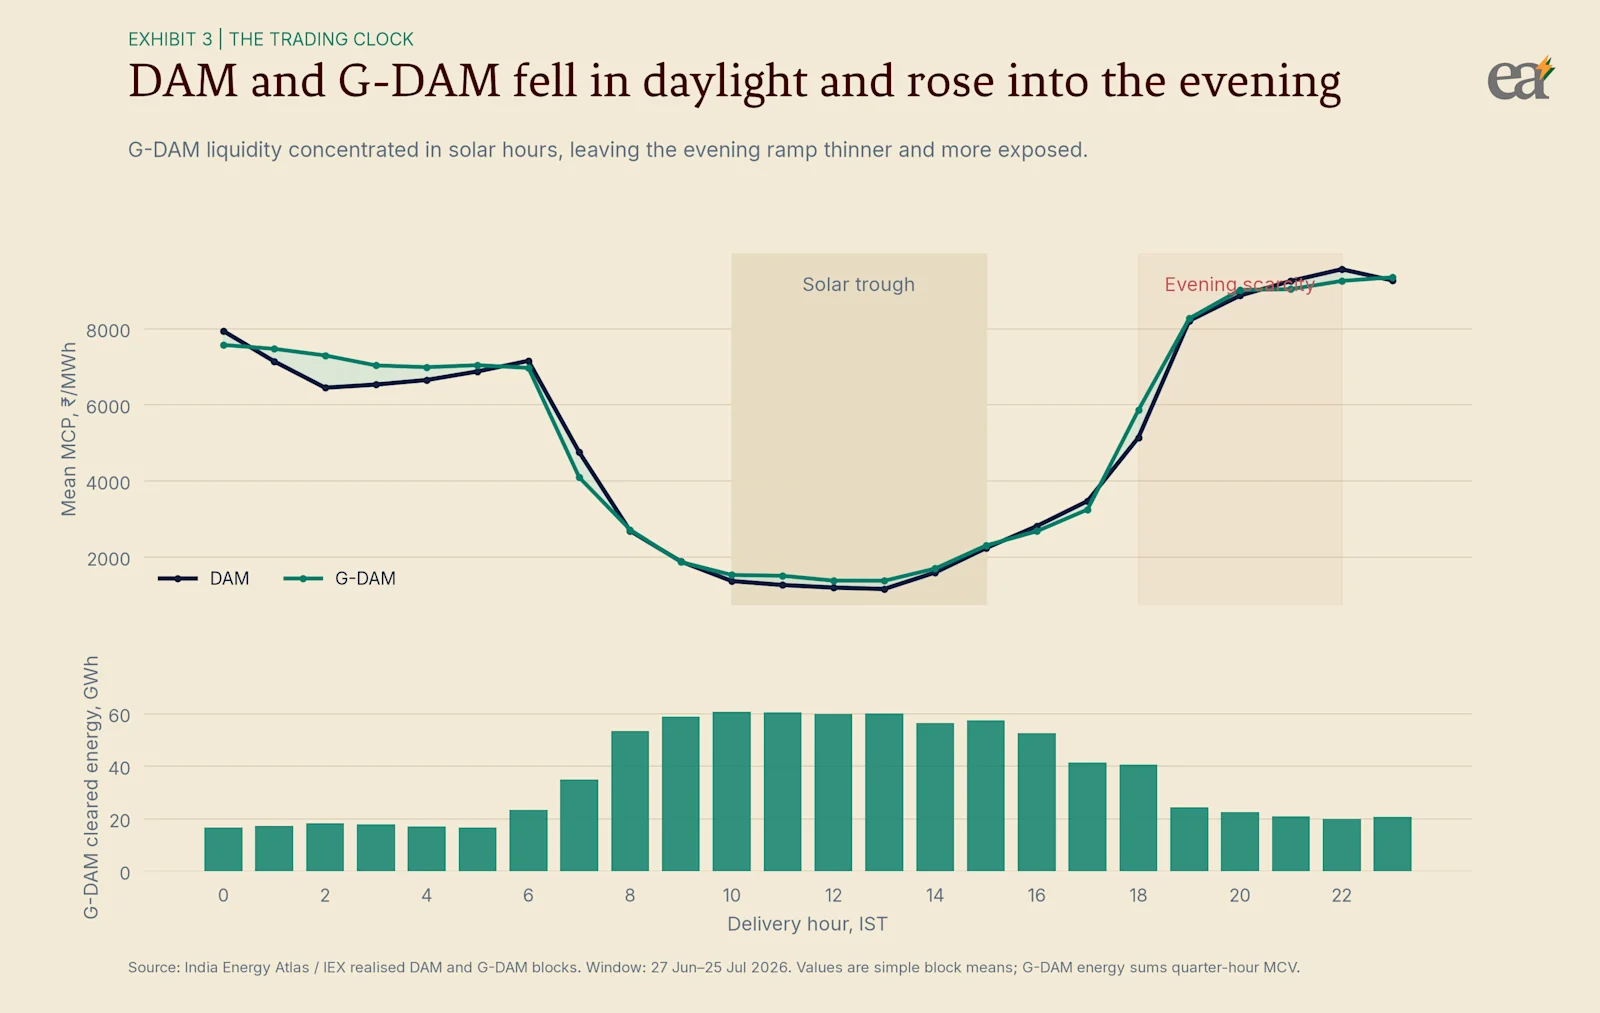
Daily averages hide the commercial mechanism. Prices compressed during renewable-rich daylight and rose sharply into the evening. G-DAM liquidity was concentrated around solar delivery and became thinner near the ramp.
For a trader, weather belongs inside an hourly stack. Cloud can tighten the solar trough, wind can soften the ramp and rain can reduce cooling demand while weakening solar supply. The same weather forecast can imply opposite positions at noon and after sunset.
For a commercial buyer, flexible process loads, chilled-water systems, pumping and storage can migrate consumption toward cheaper hours. A flat procurement forecast cannot value that option.
Wind explained scarcity better than most weather variables #
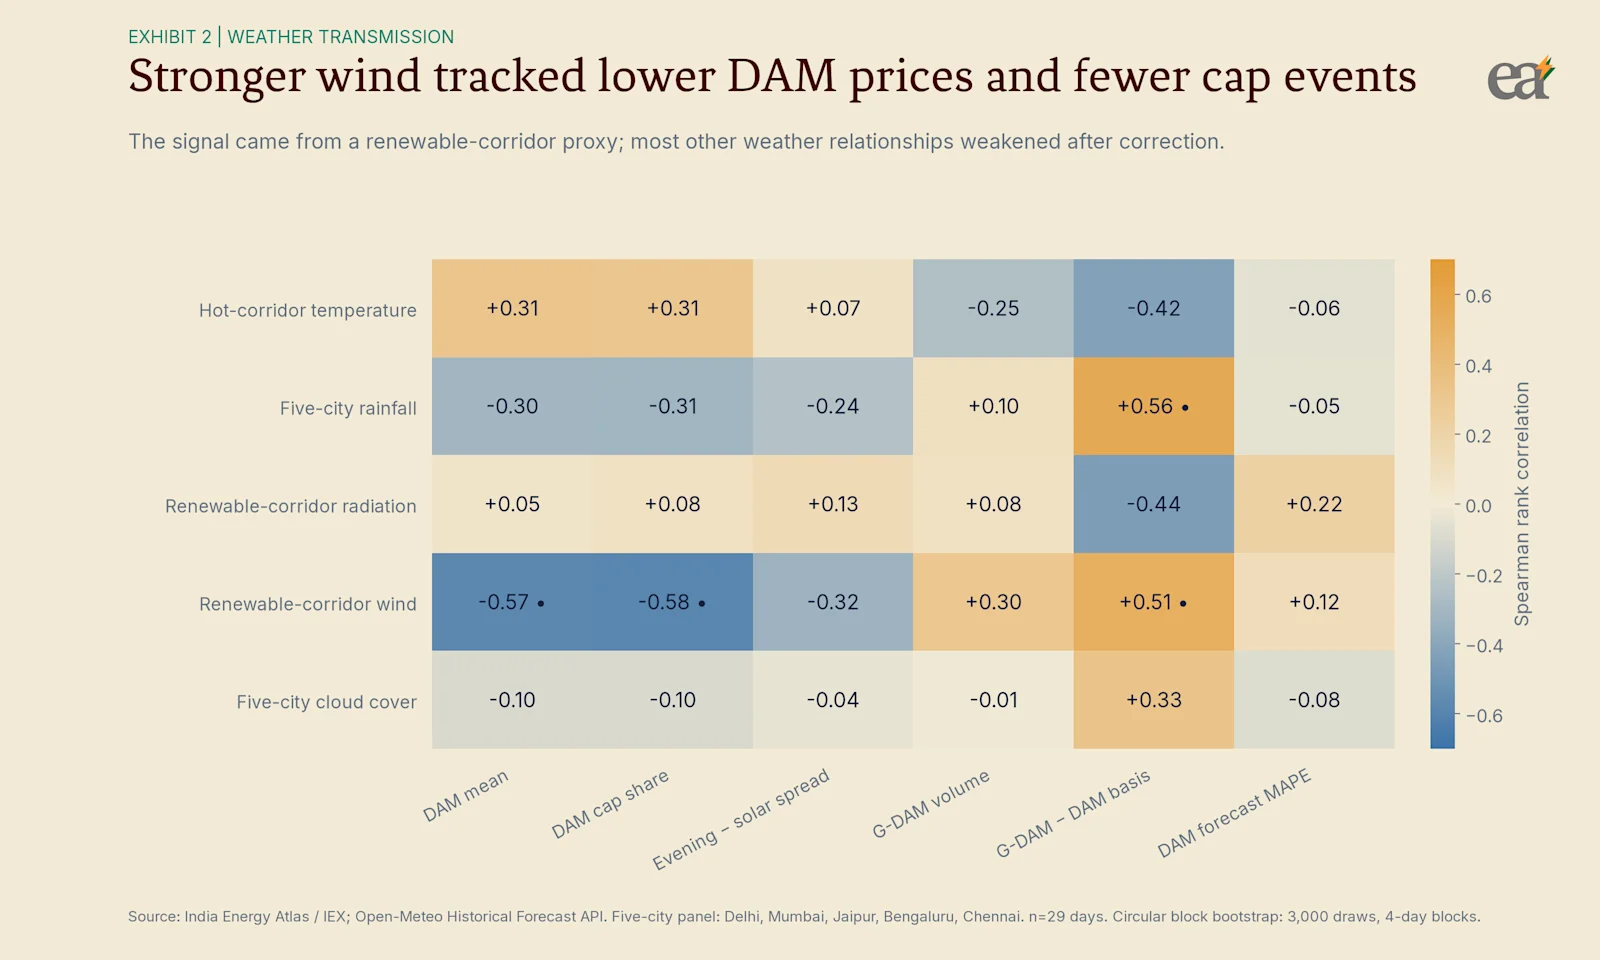
The statistical pass used rank correlations, block-bootstrap uncertainty and false-discovery control across the full test family. Stronger wind across a western and southern renewable corridor coincided with lower DAM prices and fewer ceiling events. Rain and wind also moved with the G-DAM basis. Most other apparent relationships weakened after adversarial testing.
The IEX rule that carries eligible uncleared G-DAM orders into DAM is part of the explanation because the two auctions are institutionally connected. Liquidity and bidding behaviour can resemble a weather effect when green supply is thin.
I don’t know whether the wind relationship will survive the next monsoon. A short city-level weather panel cannot settle that. I do know what a responsible desk should do next: test plant-level renewable forecasts, demand, outages, hydro schedules and corridor constraints before increasing position size.
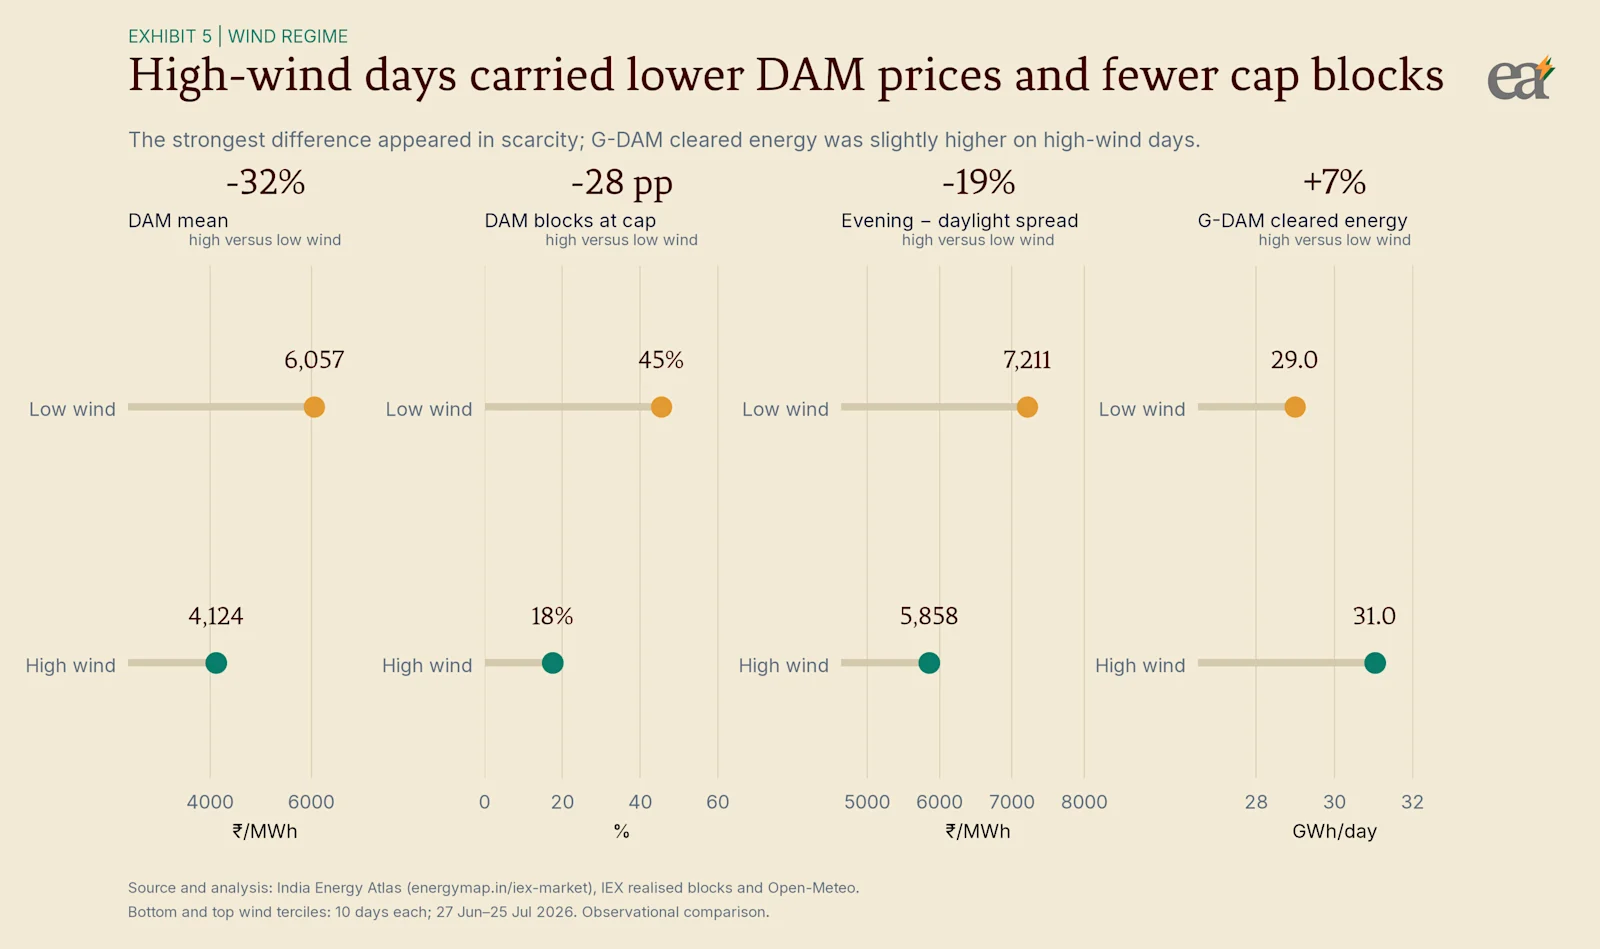
Regime splits turn that statistical signal into a trading question. Days in the high-wind group carried lower average DAM prices, fewer ceiling blocks and a narrower evening-versus-daylight spread, while G-DAM cleared energy was slightly higher. The combination matters: wind may soften scarcity while improving green liquidity, so the hedge is a joint view of outright DAM, the G-DAM basis and execution depth. A renewable forecast used only as a price regressor misses the liquidity channel. The grouping is observational and shares common causes with demand, hydro, outages and network conditions; it can size conviction without claiming causality.
Open-access buyers face a landed-cost problem #
The exchange price is only the opening line of a C&I procurement decision. The Green Energy Open Access framework widened eligibility for commercial and industrial consumers, while the amended rules enumerate transmission, wheeling, cross-subsidy, standby, banking, scheduling and deviation charges. State implementation and tariff orders determine the final economics.
This produces two layers of basis risk: the gap between MCP and landed cost, then the gap between contracted supply and the factory’s load shape. Monsoon weather can move both. A cheap daylight block has little value if production cannot shift, while a forecast miss can surface through deviation exposure, standby procurement or an expensive residual purchase.
The state matrix shows why weather beta cannot be lifted from a national model and dropped into a factory hedge. Gujarat’s recent load was most temperature-sensitive, Andhra Pradesh and Karnataka carried stronger wind-and-irradiance signatures, and Rajasthan stood out for cloud cover. These are distinct operating problems. A heat-sensitive consumer needs peak cover; a solar-linked campus needs intraday flexibility; a wind-linked industrial cluster may face a different G-DAM basis and deviation profile. For a storage investor, the valuable spread is the mismatch between local load sensitivity and the exchange’s systemwide scarcity signal, after open-access charges and network availability.
The practical portfolio is layered. Captive generation or a PPA can hedge the structural load; DAM manages the residual; G-DAM can cover a green shortfall; RTM repairs the final imbalance. The forecast should optimise that portfolio, not celebrate a low spot price in isolation.
The investment lesson is subtle. An exchange covering a small slice of national electricity can still determine the price of the marginal shortfall, shape the reference used in bilateral negotiation and reveal where flexibility is scarce. Monetising that signal depends on geography. Storage, demand response and hybrid supply earn value where site-level residual load, weather sensitivity and market access line up. A volatile DAM alone is not a bankable revenue forecast.
Forecast accuracy needs a financial benchmark #
MAPE is useful for audit, yet a desk earns money on the open position after volume, charges and imbalance risk. During the observed DAM window, central error, calibrated intervals and scarcity discrimination told different but complementary stories. Transition days were harder than some cap-heavy days.
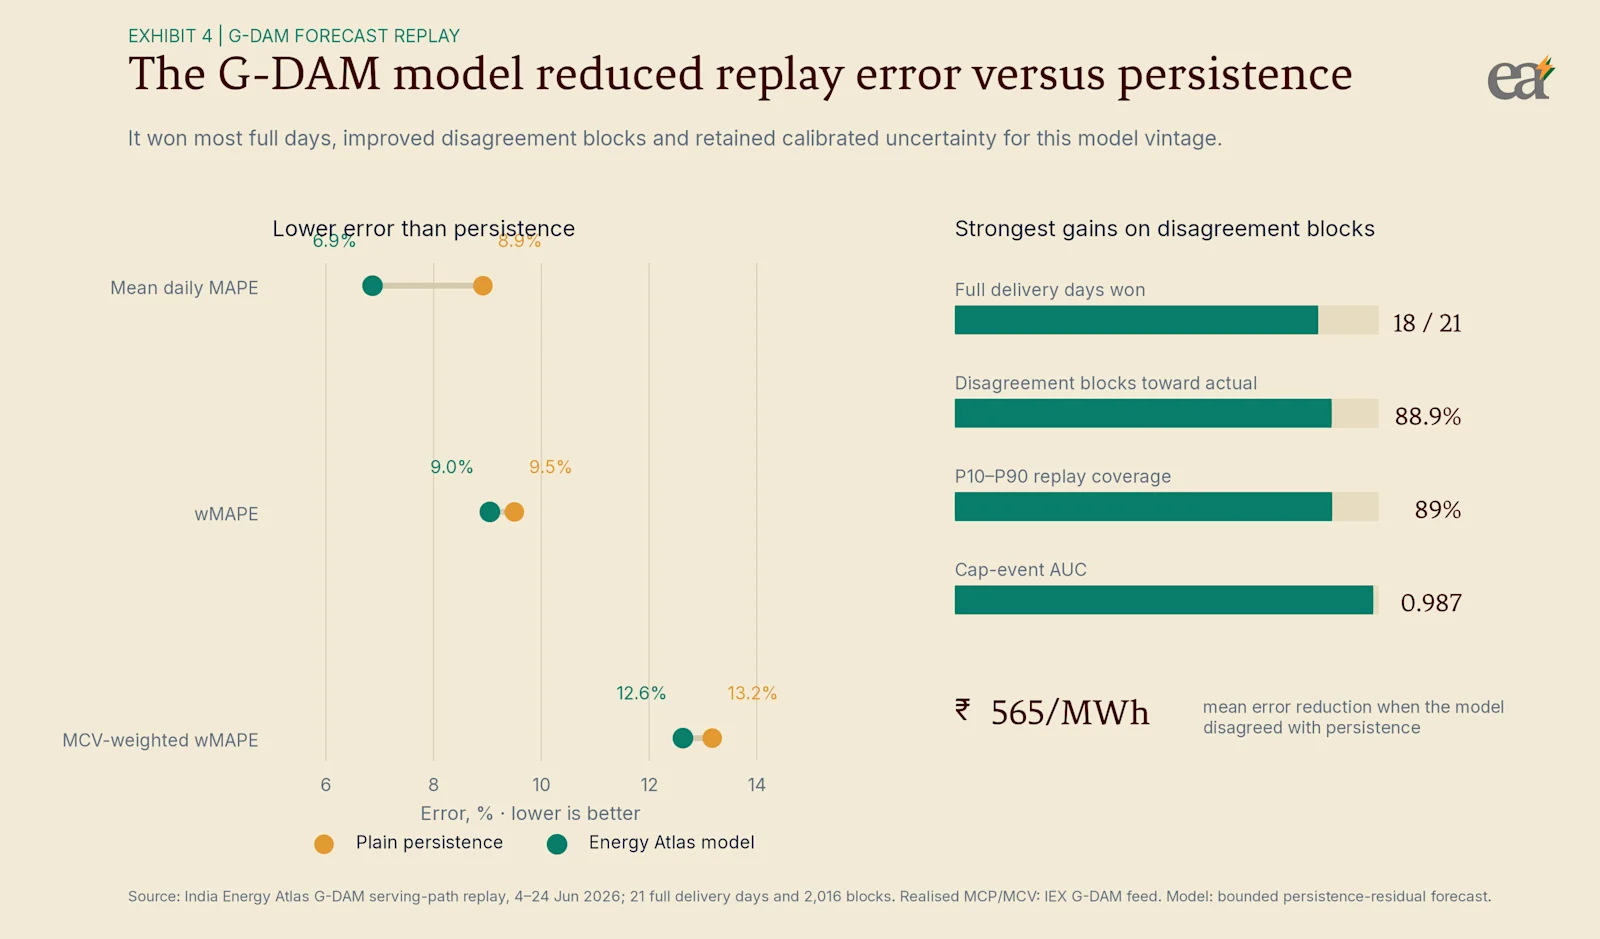
The separate G-DAM evidence comes from a dated serving-path replay. Its bounded persistence-residual model lowered average error against plain persistence and concentrated improvement in blocks where the two forecasts disagreed. The forecast-history surface makes realised performance inspectable, while the developer interface can carry the same audit trail into procurement systems.
For C&I buyers, the next benchmark should be avoided landed cost against an approved procurement policy. That would weight errors by residual load, delivery hour, open-access charges and deviation consequences. A beautiful national MAPE can coexist with a poor factory bill.
The development-economics trade-off #
Open access can improve choice, reveal flexibility and accelerate corporate renewable procurement. It can also move creditworthy C&I demand away from distribution companies that rely on those consumers to support cross-subsidies. Opaque charges weaken competition; ignored stranded obligations shift costs toward utility finances and subsidised consumers.
Policy therefore needs transparent, predictable landed charges alongside gradual cross-subsidy reform. Weather-linked scarcity data can guide storage and demand response, but exchange prices alone cannot measure consumer welfare in a tariff system shaped by contracts, subsidies and state regulation.
What I would watch next #
I would track the residual load of each buyer, not national demand alone; compare DAM scarcity and the G-DAM basis separately; and size trades from calibrated intervals after applying landed-cost and liquidity filters. For policymakers, aligned publication of weather vintages, outages, constraints, bids, schedules and actuals would make private forecasts easier to audit.
I don’t know whether this window marks a durable climate-price relationship or a temporary conjunction of weather and outages. That uncertainty invites traders, C&I managers and regulators to test the mechanism against their own load, contracts and network position.
Weather becomes tradable only after it passes through the residual portfolio, delivery hour and grid. The next advantage will belong to those who keep that chain visible—watching each forecast meet the auction, each market signal meet the network and each assumption meet the next day’s actuals. India’s power market will keep changing block by block; the India Energy Atlas Journal will keep tracing the evidence. Stay close to the map. The next weather front may already be forming.
Sources & method
Realised DAM and G-DAM blocks came from the India Energy Atlas market surface and source-specific IEX feeds for 27 June through 25 July 2026. DAM diagnostics came from the authenticated production history surface. G-DAM forecast evidence is a separate replay-honest serving-path study dated 24 June 2026. Market-weather analysis uses a five-city Open-Meteo historical-forecast panel. The state exhibits use the Atlas weather_load_correlation_daily store for the seven-day window ending 26 July 2026: 35 states, 162–168 hourly pairs, blended official-then-modeled demand, and state-capital Open-Meteo weather. CERC monthly reports supply the market-scope benchmark: collective exchanges were 7.54% of CERC's defined generation in June 2025 and 9.01% in January 2026; that denominator excludes renewable and captive generation, so no fixed IEX share is asserted. Ministry of Power rules supply the green open-access framework and charge categories. Statistical results are observational and cannot isolate outages, demand, hydro, constraints, bid depth or portfolio behaviour.