

The coal stock average hides the plants that are actually short
India's daily coal stock is reported as an average across monitored plants. The relationship between that average and the count of critically short plants steepens sharply exactly where it starts to matter.
A number that is reported and a number that matters #
India's coal stock position is published daily and reported widely as a single figure, usually the average number of days of stock held across monitored plants. It is a reasonable summary statistic and a poor risk indicator, and the difference between those two things is worth setting out carefully.
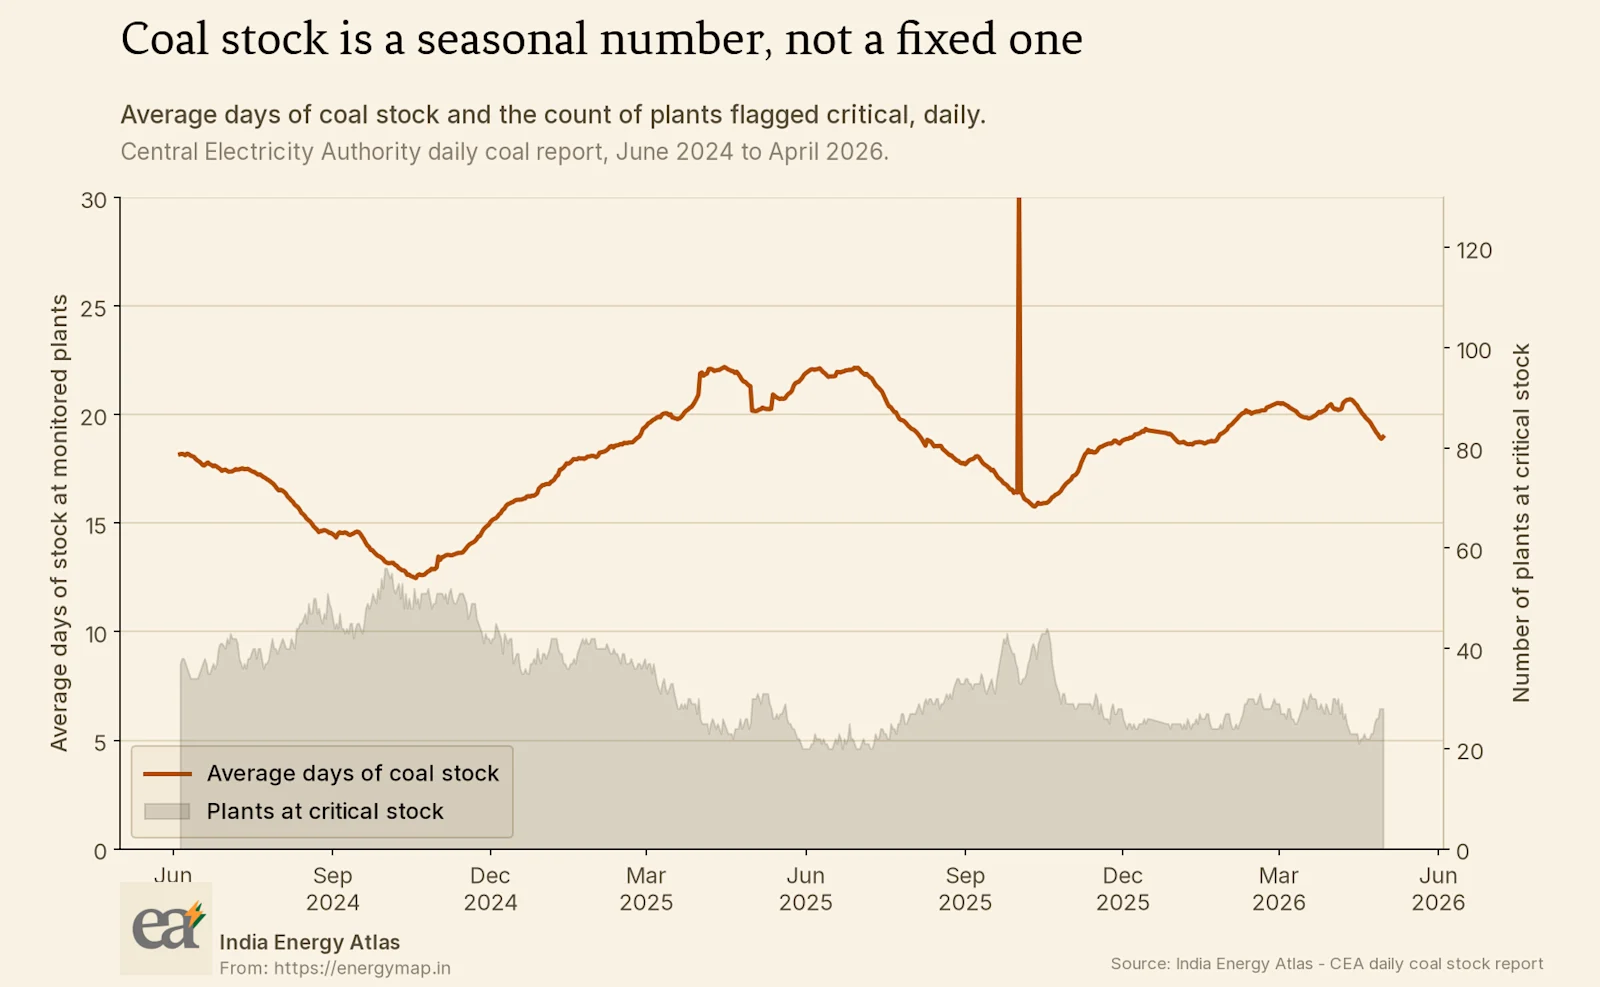
The average moves seasonally, drawing down through the monsoon when mining and transport are hardest and rebuilding afterwards. Read on its own, the series looks manageable. The average rarely approaches anything that would be described as a crisis.
The second series on that chart is the one that carries the information. It counts plants individually flagged as critically short. It moves differently from the average, and it moves further.
Why the average hides the risk #
Plotting the two against each other shows the structure directly.
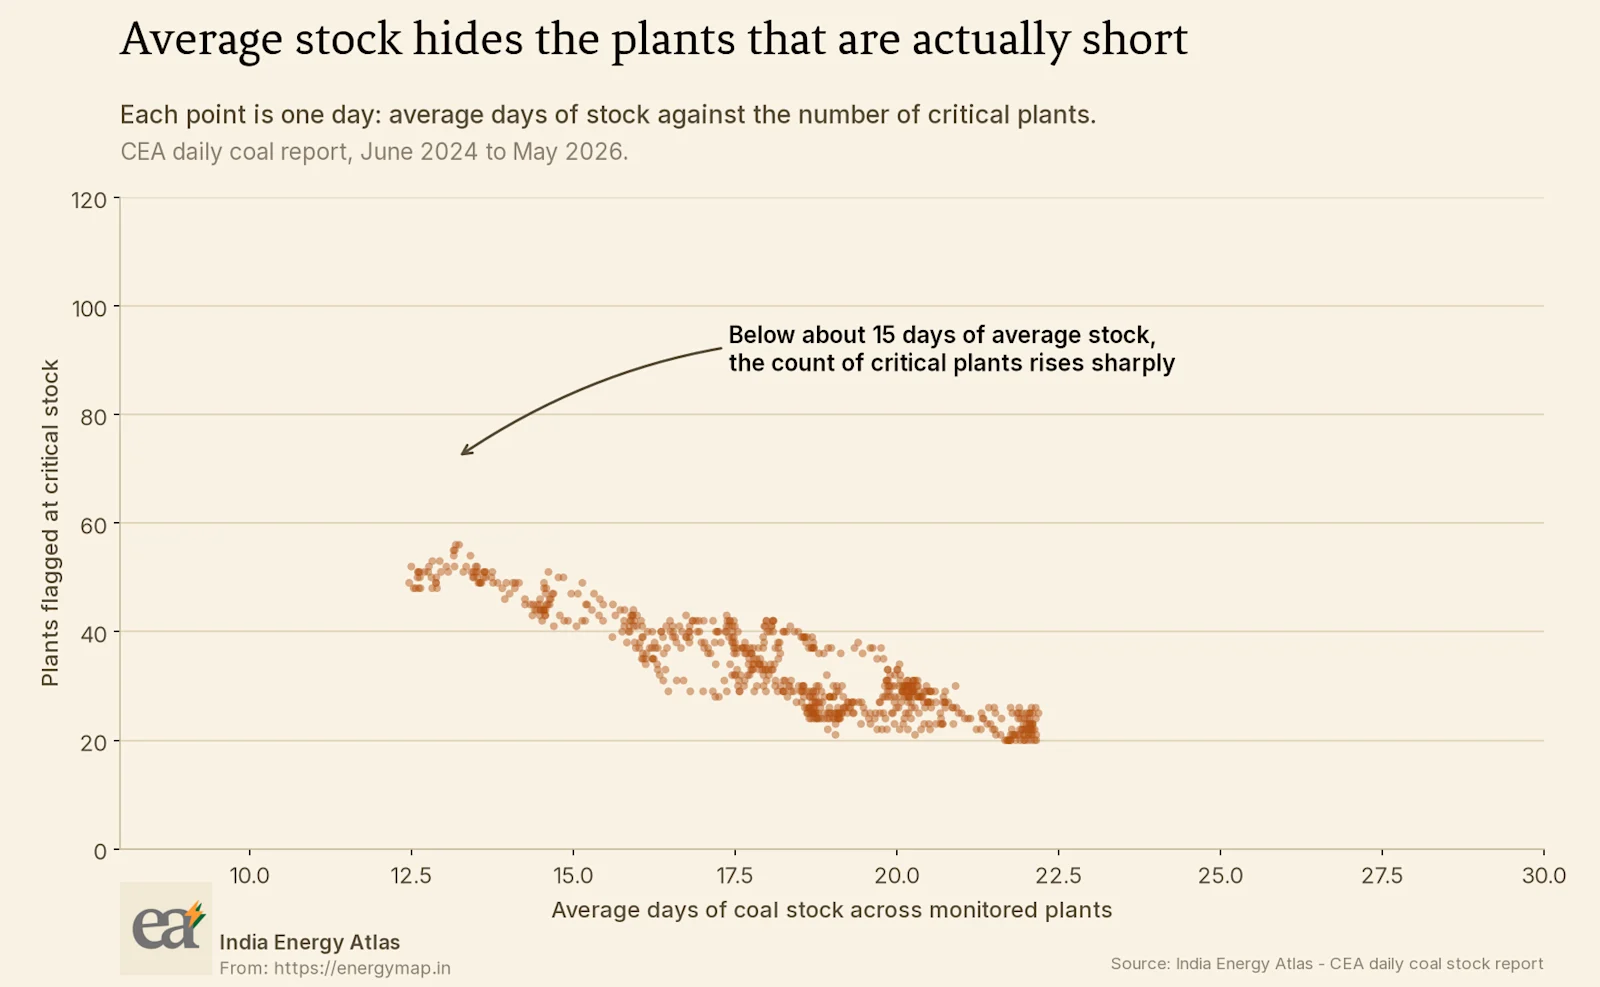
The relationship is not linear. Across most of the range, a decline in average stock is associated with a modest rise in the number of critical plants. Below roughly a fortnight of average stock, the count of critical plants rises sharply for the same incremental decline in the average.
This is what one would expect from a distribution with a long lower tail. The average is held up by plants sitting on comfortable stock, typically pithead stations with short supply chains. The plants that go critical are the ones at the end of long rail hauls, and their position deteriorates faster than the average suggests because the average is dominated by units that are not at risk.
A system-wide average is a statement about the middle of a distribution. Reliability is decided in the tail.
What this does and does not tell me #
I am confident about the shape of the relationship, because it is visible across two years of daily observations and it is consistent with the physical structure of Indian coal logistics.
I am not able to say from this data what quantity of generation was actually at risk on any given day. A plant flagged critical is a plant whose stock has fallen below a normative threshold, and that is a supply chain warning rather than an outage. Many critical plants continue to generate normally for extended periods. Converting a critical count into megawatts at risk would need unit-level stock, delivery schedules and dispatch position together. I do not have that combination, and I do not know the conversion.
I can also not distinguish, in this data, between a plant that is critical because of transport constraints and one that is critical because it was not scheduled to run much anyway. Those two are very different from a reliability perspective and they look identical in the reported series.
What the data does establish is that the headline average is a weak predictor of the thing a planner cares about, and that the relationship between them changes exactly in the region where it starts to matter.
The same pattern in other reported indicators #
Coal stock is the clearest example of this problem and it is not the only one. The pattern recurs wherever a system-level average is published as a proxy for a distributional risk.
National generation adequacy is reported as a reserve margin, which is a single number computed against a coincident peak. It says nothing about whether the reserve is located where the constraint binds. A comfortable national margin is consistent with a specific region being short during a specific hour, and the regional detail is what an operator needs.
Average plant availability behaves the same way. A fleet averaging high availability can contain a subset of units with correlated outage risk, and correlated outages are the ones that matter. The average is reassuring precisely because it dilutes the correlation.
Renewable capacity factors reported as annual averages hide the multi-day low-generation events that determine storage adequacy. I raised this in the context of state net load and it applies identically here.
In each case the reported statistic is not wrong. It measures the centre of a distribution accurately. Reliability is a property of the tail, and no amount of precision about the centre substitutes for information about the tail. This is a reporting design problem rather than an analytical one, and it is cheap to fix because the underlying distributional data is already being collected in order to compute the average.
The decision this affects #
Coal stock enters system planning as an input to availability assumptions. A model that assumes thermal availability is a fixed percentage, or that derates it in proportion to average stock, will misestimate risk in the region where the relationship steepens.
The alternative is not more complicated. It requires the availability assumption to be a function of the tail of the stock distribution rather than its mean, and it requires the model to be re-run when the tail moves. That is a monthly operation at most, and the data to do it is published daily.
This is a recurring pattern in the studies that do not get run. The input exists, the method is not difficult, and the analysis falls outside the scope of the exercise anyone is currently funding.
So what, and for whom #
For a system operator. Tracking the count of critical plants and their combined capacity gives an earlier warning than the average, and the lead time is the whole value of the indicator.
For a utility procurement team. The months when the average approaches the region where the relationship steepens are the months to have already contracted alternative supply. Reading the average alone will give that signal late.
For a regulator. Requiring that thermal availability assumptions in adequacy filings be justified against the stock distribution rather than the average would be a small change with a real effect on the quality of those filings.
For a trader. The critical plant count is a leading indicator of thermal availability, and thermal availability is what sets the marginal price in the evening block. The relationship is not currently priced with much sophistication.
The daily coal stock series is published with the rest of the Atlas data products, and the state pages for coal-heavy systems such as Chhattisgarh, Madhya Pradesh and Maharashtra carry the corresponding generation picture.
Sources & method
Central Electricity Authority daily coal stock report as ingested by the India Energy Atlas, June 2024 to May 2026, covering roughly 190 monitored plants. Days of stock and critical flags are as reported by CEA against normative thresholds. A critical flag is a supply-chain warning rather than an outage; many flagged plants continue to generate normally. Cover photograph by Gabriela on Unsplash.