
Showing a locked capability instead of hiding it
Eight numbers on a personal home page, four of them locked for a free reader. Here is why a locked card is drawn greyed and still reachable, what one batched request buys, and the forced write that proves the browser was never the gate.
Every product with more than one plan has to answer a small design question that turns out to carry a lot of weight: what does a reader see where a capability they do not have would be? The two honest answers are an empty space and a visible, disabled thing. We went with the second, and this post is about what that decision cost and what it bought.
The surface is the metric grid on the personal home page — eight numbers about the Indian grid, pinned by the reader, refreshed on a clock they choose. Four of them are open to everyone and four are part of Atlas Pro. Everything below is the machinery that makes that boundary real, and the reasoning behind the one part of it that is purely a judgement call.
Eight numbers on a landing page
A metric card is four things stacked in a fixed-height box: a value with its unit, a delta chip, a 24-point sparkline, and a footer badge naming the scope and how often the card refreshes. The height is fixed on purpose — a card that grew to fit its content would shove the rest of the auto-fill track down the moment a value landed, and the grid is the first thing on the page.
The v1 catalogue spans four categories deliberately, because the point of the grid is a reader assembling a view of a problem rather than a view of one feed. Demand, CO2 intensity, renewable share and system frequency come off the grid feeds. Live tenders is a market count. Policies published this month is an institutional one. Substations on record and data centres tracked are infrastructure. A transmission planner and a procurement analyst want overlapping but different subsets, and neither of them wants the other's.
{"key": "demand_national",     "category": "grid",           "min_plan": "free", "min_refresh": "5m",  "access": "available", "min_refresh_for_plan": "1h"}
{"key": "co2_intensity",       "category": "grid",           "min_plan": "free", "min_refresh": "1h",  "access": "available", "min_refresh_for_plan": "1h"}
{"key": "re_share",            "category": "grid",           "min_plan": "free", "min_refresh": "1h",  "access": "available", "min_refresh_for_plan": "1h"}
{"key": "grid_frequency",      "category": "grid",           "min_plan": "free", "min_refresh": "5m",  "access": "available", "min_refresh_for_plan": "1h"}
{"key": "tenders_live",        "category": "market",         "min_plan": "pro",  "min_refresh": "6h",  "access": "locked",    "min_refresh_for_plan": "6h"}
{"key": "policies_month",      "category": "institutional",  "min_plan": "pro",  "min_refresh": "24h", "access": "locked",    "min_refresh_for_plan": "24h"}
{"key": "substations_scope",   "category": "infrastructure", "min_plan": "pro",  "min_refresh": "24h", "access": "locked",    "min_refresh_for_plan": "24h"}
{"key": "datacenters_tracked", "category": "infrastructure", "min_plan": "pro",  "min_refresh": "24h", "access": "locked",    "min_refresh_for_plan": "24h"}
Two fields on that row are the whole gating contract, and both are computed by the server for the caller who asked. access says whether this reader may have a number for this key. min_refresh_for_plan says the fastest clock this reader may put the card on, which is the metric's own floor or the account's, whichever is coarser. The frontend reads both and draws them. It works out neither.
The period travels with the number
Here is the detail that most dashboards get wrong, ours included until we looked at it. A delta chip on a card says something like “down 2.1% vs yesterday”, and the phrase at the end is almost always a constant somewhere in the component. That is fine right up until the catalogue contains a metric whose feed does not move daily.
Two of ours do not. Live tenders and policies published are ledger counts that change a handful of times a week, and a day-on-day comparison on either is usually zero — a chip that says “unchanged vs yesterday” every day, which is worse than no chip, because it reads as information. So the period is computed with the value, by the query that knows the metric's cadence, and it ships in the payload next to the magnitude.
"key": "demand_national", "value": 232512.0, "unit": "MW",
  "delta": {"period": "d/d", "abs": -5045.0, "pct": -2.1}

"key": "tenders_live",    "value": 15.0,     "unit": "count",
  "delta": {"period": "w/w", "abs": 0.0, "pct": 0.0}
The frontend's side of this is nine lines and no cleverness. A token maps to a phrase, and a token the build does not recognise is rendered verbatim after “vs” — terse, and true, which beats confidently claiming the wrong comparison window.
const PERIOD_PHRASE: Record<string, string> = {
  "h/h": "vs last hour",
  "d/d": "vs yesterday",
  "w/w": "vs last week",
  "m/m": "vs last month",
  "y/y": "vs last year",
};

export function periodPhrase(period: string): string {
  return PERIOD_PHRASE[period] ?? `vs ${period}`;
}
The same reasoning drives the sparkline's grain. Four grid metrics move within the hour and spark hourly; the four counts move over days and spark daily. Twenty-four daily buckets on a count is most of a month of history. Twenty-four hourly ones would be twenty-four copies of the same number drawn as a flat line.
One request, and a clock per metric
Eight cards could easily have been eight requests. Each card knows its own key, its own scope and its own refresh interval, and a data-fetching hook inside the card component is the obvious shape. It is also how a landing page ends up making a dozen round trips before it has drawn anything.
The grid owns the fetching and hands each card its row. One request per scope, on the shortest interval any card in it asked for, with the keys in the query string. On the server that becomes one Redis MGET through a pipeline, and Postgres is reached only for what the cache missed.
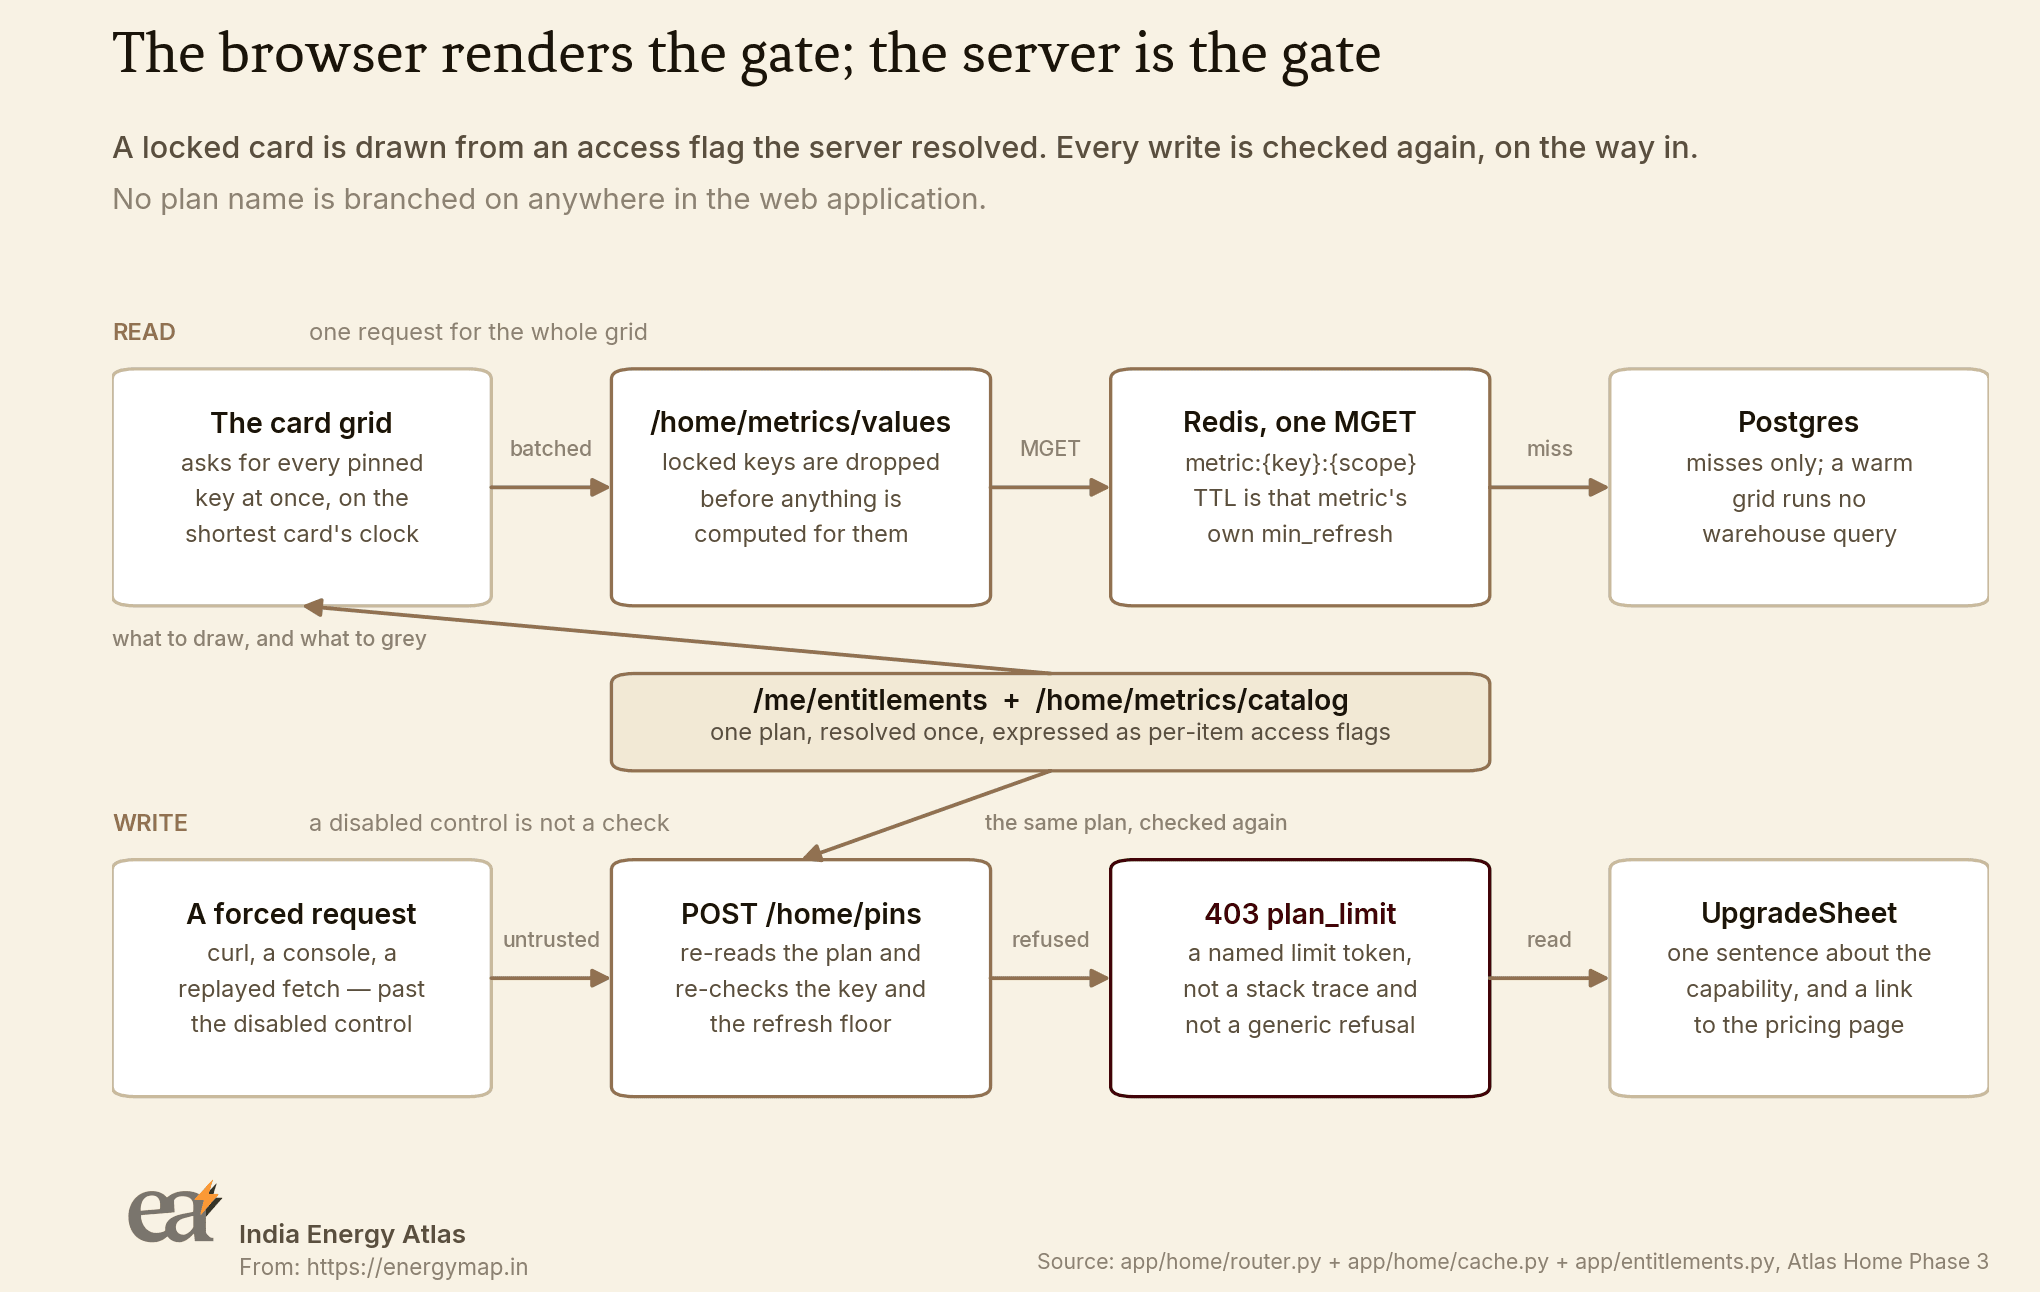
app/home/router.py and app/home/cache.py.The cache key is metric:{key}:{scope} — one entry per metric per scope, so two readers watching Maharashtra share an entry and a national card can never be served a state number. The lifetime of that entry is the metric's own min_refresh rather than one number for the whole cache, and that is the part worth arguing for.
A global TTL has to be set for the fastest-moving thing in the catalogue, because anything slower would serve a stale frequency reading. Set it there and a policy count gets recomputed every five minutes for a feed that changes twice a week. Set it for the slow end and the frequency card lies. Per-metric lifetimes make the question go away: each entry lives exactly as long as the metric's own floor, which is also the fastest clock any card may be put on, so the cache can never be the reason a card is stale.
$ docker exec blog-clean-p3-redis-1 redis-cli --scan --pattern 'metric:*' | sort \
  | while read k; do printf '%-38s %s\n' "$k" \
      "$(docker exec blog-clean-p3-redis-1 redis-cli ttl "$k")"; done

metric:co2_intensity:national          3479
metric:datacenters_tracked:national    86279
metric:demand_national:gujarat         288
metric:demand_national:national        179
metric:grid_frequency:national         179
metric:policies_month:national         86279
metric:re_share:gujarat                3588
metric:re_share:national               3479
metric:substations_scope:national      86279
metric:tenders_live:gujarat            21588
metric:tenders_live:national           21479
Three orders of magnitude between the shortest and the longest, in one cache, with no coordination. The integration run asserts this rather than trusting it: it reads the remaining lifetime of every key back and compares it to the catalogue row it came from, and it checks that a warm batch computes nothing at all.
3. Batched endpoint: cold computes, warm does not
  [PASS] cold batch computed all 8 — 8 computes
  [PASS] warm batch computed 0 — 0 computes
  [PASS] warm payload identical to cold

4. Redis TTL equals each metric's min_refresh
  [PASS] demand_national: ttl ~= 5m (300s) — 300s
  [PASS] co2_intensity: ttl ~= 1h (3600s) — 3600s
  [PASS] re_share: ttl ~= 1h (3600s) — 3600s
  [PASS] grid_frequency: ttl ~= 5m (300s) — 300s
  [PASS] tenders_live: ttl ~= 6h (21600s) — 21600s
  [PASS] policies_month: ttl ~= 24h (86400s) — 86400s
  [PASS] substations_scope: ttl ~= 24h (86400s) — 86400s
  [PASS] datacenters_tracked: ttl ~= 24h (86400s) — 86400s
Showing what a reader does not have
Now the judgement call. A free reader opens the Customize modal and sees ten rows, four of which they cannot select. On the grid itself they see their own cards and one greyed teaser at the end. None of it is hidden.
The argument for hiding is real and I want to state it fairly: a surface with nothing unavailable on it is calmer, and a reader who never sees a lock never feels sold to. The argument against is that it makes the product unlearnable. Somebody who never sees that the catalogue contains a live tender count has no way to discover the capability except by reading a pricing page they have no reason to open. Hidden capability is capability that only existing customers know about, which is a strange thing to build on purpose.
A lock is an honest statement about a product boundary. An empty space is a statement too, and it is a false one.
So a locked card is the same box as a live one, greyed, with a lock glyph, a chip reading Atlas Pro, a blurred decorative spark that is explicitly not data, and two em-dashes where the number would be. It keeps the live card's geometry so the two sit on one baseline in the grid instead of the locked one reading as a stub.
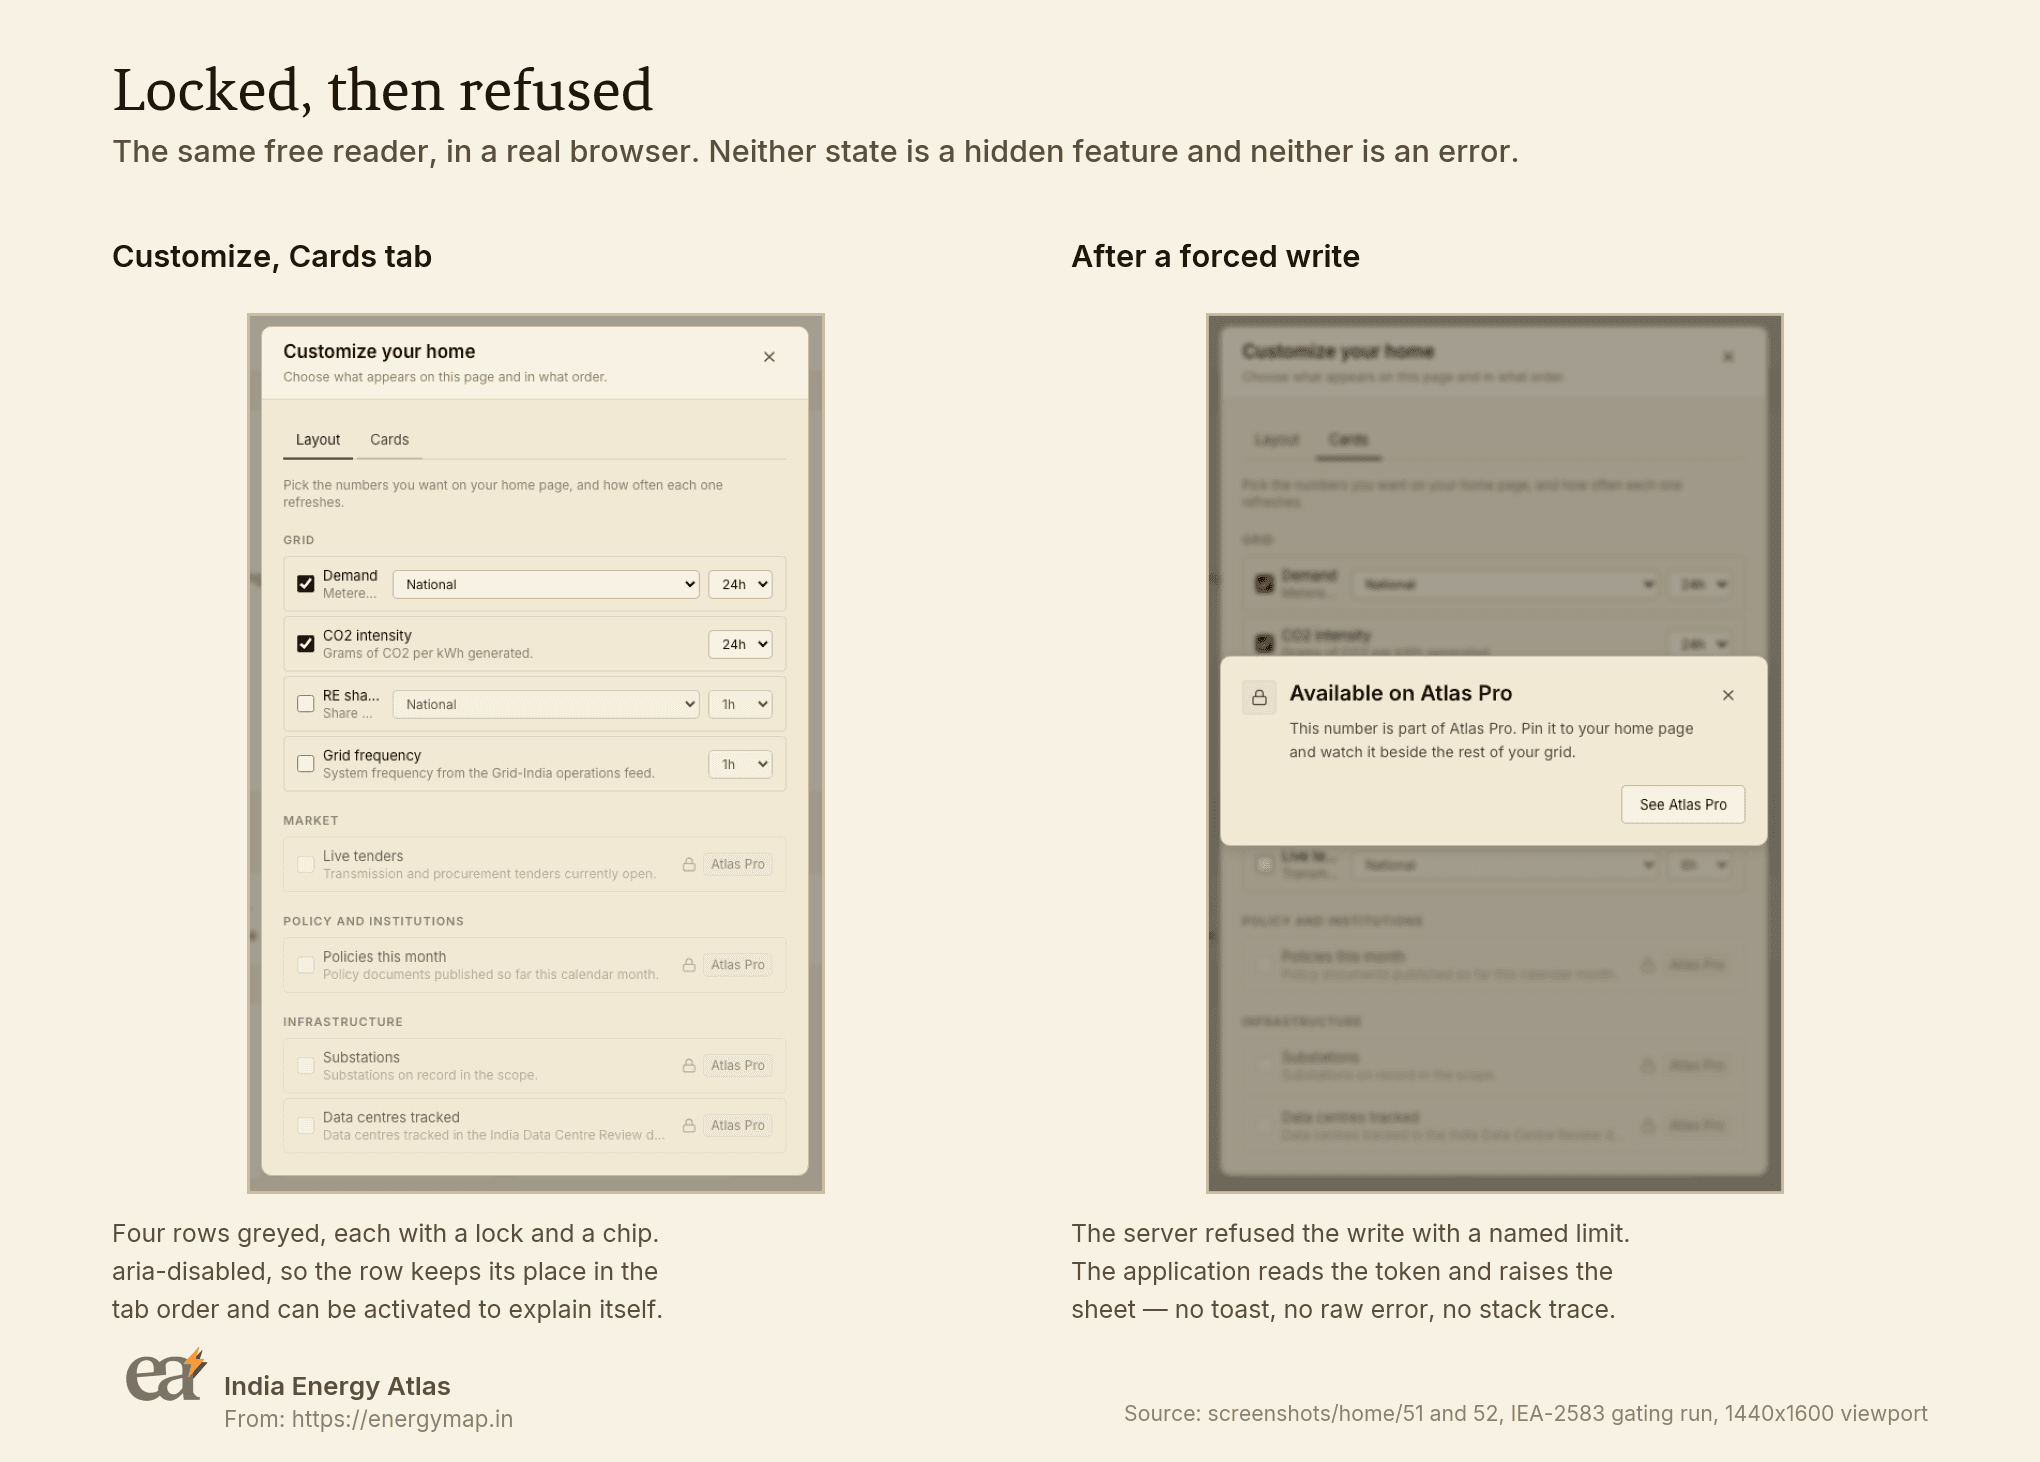
The accessibility decision inside that is aria-disabled in place of disabled, and it follows directly from the visibility decision. A natively disabled control is removed from the tab order, does not fire hover, and cannot be activated. A keyboard or screen-reader user would meet the locked card as a gap in the tab sequence with no way to ask what it is — which is the hidden-capability outcome again, arriving through an implementation detail rather than a decision.
aria-disabled announces the state and keeps the affordance reachable. The card carries tabIndex={0}, an accessible name that includes the reason, a native title for a mouse and an aria-describedby span carrying the same sentence for a screen reader, which never sees title. Enter and Space do what a click does.
<section
  role="button"
  tabIndex={0}
  aria-disabled="true"
  aria-label={`${item.title} — ${LOCKED_TOOLTIP}`}
  aria-describedby={tooltipId}
  // The native tooltip for a mouse; the described-by span below is the
  // same sentence for a screen reader, which never sees `title`.
  title={LOCKED_TOOLTIP}
  onClick={open}
  onKeyDown={(event) => {
    if (event.key !== "Enter" && event.key !== " ") return;
    event.preventDefault();
    open();
  }}
The Cards tab rows follow the same rule, with one addition: the checkbox itself is natively disabled while its row is aria-disabled. The control that would change state is genuinely inert; the row that explains why is not.
Where the gate actually is
Everything above is presentation. A greyed card is a rendering of a decision, and a rendering can be edited by anyone with a developer console. So the second half of this phase is the half that matters: the server decides, and it decides again on the way in.
There are two reads that carry the decision outward. GET /me/entitlements returns the caller's plan and its floors, and GET /home/metrics/catalog returns every catalogue row with the access and min_refresh_for_plan fields resolved for that caller. The web application encodes no plan rule of its own, and that is enforced rather than asserted — a source-level guard greps every Atlas Home file for a plan name used as a branching condition, alongside the currency and tier-number checks.
it("encodes no plan name as a branching condition", () => {
  // Gating renders from `access` flags and entitlements; a literal plan name
  // driving an `if` would be the frontend deciding what a reader may see.
  const PLAN_LITERAL = /[=!]==?\s*["'](?:free|pro|starter|enterprise)["']/i;
  for (const file of SOURCES) {
    expect(read(file), `${file} branches on a plan name`).not.toMatch(PLAN_LITERAL);
  }
});

$ npx vitest run components/home/atlas-home.guard.test.ts

 Test Files  1 passed (1)
      Tests  156 passed (156)
On the write side, every path that stores a pin re-reads the plan and re-checks two things: whether the key is part of it, and whether the requested refresh interval clears the account's floor. A refusal is a 403 with a body that names which limit it hit. The forced write below skips the interface entirely — it is a curl at the API, asking for a locked key on a free account.
$ curl -s -i -X POST http://127.0.0.1:8058/api/v1/home/pins \
    -H 'Content-Type: application/json' \
    -d '{"pin_type":"metric","config":{"metric_key":"tenders_live","scope":"national"},"refresh":"24h"}'

HTTP/1.1 403 Forbidden
date: Sun, 30 Aug 2026 17:30:36 GMT
server: uvicorn
content-length: 97
content-type: application/json

{"error":"plan_limit","limit":"metric_keys","message":"'tenders_live' is not part of your plan."}
One honest note on that capture. A Clerk session token cannot be minted offline, so the authenticated captures run against a short-lived harness that overrides the auth dependency and nothing else — same application, same router, same database, same entitlement check. The unauthenticated case runs against the live container and is worth seeing on its own, because it is the first door.
$ curl -s -i http://localhost:8057/api/v1/home/pins

HTTP/1.1 401 Unauthorized
content-type: application/json
x-request-id: e4c8fcfb9f644e4ea7404e359d6fea70

{"detail":"Bearer token required"}
The limit token is a contract, and the reason the refusal is structured rather than prose. The web application switches on the token to choose one sentence about the capability; it deliberately does not render the upstream message, which is operator-facing text written next to the limit constants, and would silently become reader-facing copy the next time somebody edited it on the backend. The result is that a forced write raises the same sheet a locked card raises, from a different source tag, and never a “something went wrong” toast.
The read side has the same boundary, one layer earlier. Locked keys are filtered out before anything is computed, so a free caller asking for a pro key costs no query and receives no number — no value, no unit, no spark, no timestamp, no delta. The item comes back with its key and the word locked, which is exactly what the grid needs to draw a teaser, and nothing more.
$ curl -s -i 'http://127.0.0.1:8058/api/v1/home/metrics/values?keys=demand_national,tenders_live,substations_scope'

HTTP/1.1 200 OK
content-type: application/json

{"items":[
  {"key":"demand_national","access":"available","scope":"national","value":232512.0,"unit":"MW",
   "as_of":"2026-08-30T17:00:00Z","delta":{"period":"d/d","abs":-5045.0,"pct":-2.1},
   "spark":[232032.0, ... , 232512.0]},
  {"key":"tenders_live","access":"locked"},
  {"key":"substations_scope","access":"locked"}],
 "scope":"national","unknown":[]}
Run both readers on your laptop
Everything above runs on local Docker: Postgres, Redis, the API, a worker and a scheduler, no cloud account and no credentials beyond the placeholders the Makefile supplies. What follows is a transcript of a run on a clean clone of the backend repository at this phase's tip. Both Atlas repositories are private, so the first line works for people with access — the schema, the endpoints, the queries and the refusal bodies are quoted in full above either way.
Host ports are overridable because several worktrees of this repository tend to be up at once; drop the exports for the defaults.
$ git clone --depth 1 https://github.com/India-Energy-Atlas/espresso-india-transmission-map.git blog-clean-p3
$ cd blog-clean-p3
$ export ATLAS_DB_PORT=5457 ATLAS_REDIS_PORT=6402 ATLAS_API_PORT=8057
$ export DATABASE_URL="postgresql://grid:grid@localhost:5457/grid"
$ export REDIS_URL="redis://localhost:6402/0" API_BASE="http://localhost:8057"
$ make up

 Container blog-clean-p3-db-1     Healthy
 Container blog-clean-p3-redis-1  Healthy
 Container blog-clean-p3-api-1    Started
 Container blog-clean-p3-worker-1 Started
 Container blog-clean-p3-beat-1   Started
waiting for api health...
stack up: api http://localhost:8057
Migrations are raw, additive .sql files applied in lexicographic order by a runner that is deliberately not a migration framework. This phase adds one revision and a _down.sql companion; re-running the forward target is a no-op.
$ make migrate

applying sql/migrations/tools_052_home_phase1.sql
applying sql/migrations/tools_053_home_phase2.sql
applying sql/migrations/tools_054_home_phase3.sql
migrations applied
make demo seeds the catalogue, loads a synthetic but realistically shaped thirty-day slice for the eight upstream sources so the real SQL has something to read, creates the two demo accounts, and warms the caches. The two accounts are the point of this step: one on the free plan, one on Atlas Pro, both with a home page.
$ make demo

seeded 13 tools, 3 news items
  demand rows            504
  frequency samples      864
  fuel mix + carbon rows 4032
  registry rows          88
  tracker ledger rows    102
  regulatory documents   184
metric fixtures loaded
seeded demo users + {'tool_usage_events': 90, 'dataset_view_events': 37, 'pins': 4}
{'count': 4}
{'count': 13, 'cold_start': False}
rendering due pins in the worker container
{'due': 4, 'rendered': 4, 'bytes': 267836}
Signing in as each of them and opening the Customize modal is the fastest way to see the difference, and it is what produced Fig. 2. The scripted equivalent walks the same boundary from the server side and asserts on raw bodies, which is what you want when the claim is that the browser is not the gate. It runs the signup hook, the catalogue read, both forced writes, the locked-key read and the pro path in one pass.
$ make e2e-gating

4. The free catalogue carries exactly four locked keys
    locked:    ['datacenters_tracked', 'policies_month', 'substations_scope', 'tenders_live']
    available: ['co2_intensity', 'demand_national', 'grid_frequency', 're_share']
  [PASS] exactly 4 locked — 4
  [PASS] and they are the four the Cards tab greys out
  [PASS] no plan name rides on a catalogue row

5. FORCED WRITE — POST /home/pins for a locked key
  [PASS] 403, not 201 — 403
  [PASS] body is {"error":"plan_limit","limit":"metric_keys"}

6. FORCED WRITE — POST /home/pins below the plan's refresh floor
  [PASS] 403, not 201 — 403
  [PASS] limit names the floor it hit ("min_card_refresh")
  [PASS] neither forced write stored a row — 2 pins

7. RAW RESPONSE — a locked key carries no number
  [PASS] access is "locked" — {"key": "tenders_live", "access": "locked"}
  [PASS] no `value` field on the locked item
  [PASS] no `spark` field on the locked item
  [PASS] the free key in the same batch still resolved

8. A pro reader pins tenders_live and gets a w/w number
  [PASS] 201 created — 201
  [PASS] a real value
  [PASS] delta period is w/w, not d/d — w/w
  [PASS] a pro reader has nothing locked to tease — []

result: all assertions passed
Line six is the one to sit with. Neither forced write stored a row. The interface refused in the browser, and then the server refused again when the browser was taken out of the loop — which is the only version of that sentence worth writing a test for.
What this version leaves open
Three things, stated so nobody has to discover them. The grid polls; it does not stream, so a card is at most one poll interval behind its cache entry, which is itself at most one lifetime behind the feed. Scope is per card rather than per grid, so a reader watching one state has to set it eight times, and a grid-level scope switch is a later change. And the catalogue is fixed in code for now: an operator can retitle, re-sort or deactivate a metric with an UPDATE, but a genuinely new number needs a reviewed diff, which is a constraint we like and expect to keep.
What each plan includes lives on the pricing page, which is the only surface on the site allowed to say so. If you want to see the feeds these cards read from, national demand and the generation mix are on /data, carbon intensity has its own page, and market prices are on /iex-market. The same numbers with a state focus are on the state pages — Gujarat, Maharashtra and Tamil Nadu among them.
Sources: services/tools-api/app/home/router.py, services/tools-api/app/home/cache.py, services/tools-api/app/home/metrics.py, sql/migrations/tools_054_home_phase3.sql, components/home/metrics/MetricCardLocked.tsx, lib/home/metrics.ts and lib/home/upgrade-sheet.ts in the India Energy Atlas repositories. Every terminal, HTTP and figure capture on this page is pasted or rendered from a run on a clean clone at the Phase 3 tip, on 30 August 2026.