

What a Strait of Hormuz disruption would do to Indian power prices
Gas is a little over one per cent of India's generation, which makes the volumetric exposure small. Its output tracks the day-ahead price closely, which makes the price exposure something else.
Why I am looking at this at all #
A disruption to shipping through the Strait of Hormuz is a recurring scenario in European gas analysis, and the European answer is reasonably well understood. India's answer is less well documented, and the intuition most people reach for is wrong in an instructive way.
The intuitive reading goes like this. India imports a large share of its liquefied natural gas through the strait, gas-fired plants burn that fuel, so a supply shock hits Indian electricity in proportion to how much of the country's power comes from gas. That last step is where the reasoning breaks.
Gas is very small #
The measured national generation feed lets me size the gas fleet directly rather than inferring it from installed capacity, which overstates the case because much of India's gas capacity sits idle for want of affordable fuel.
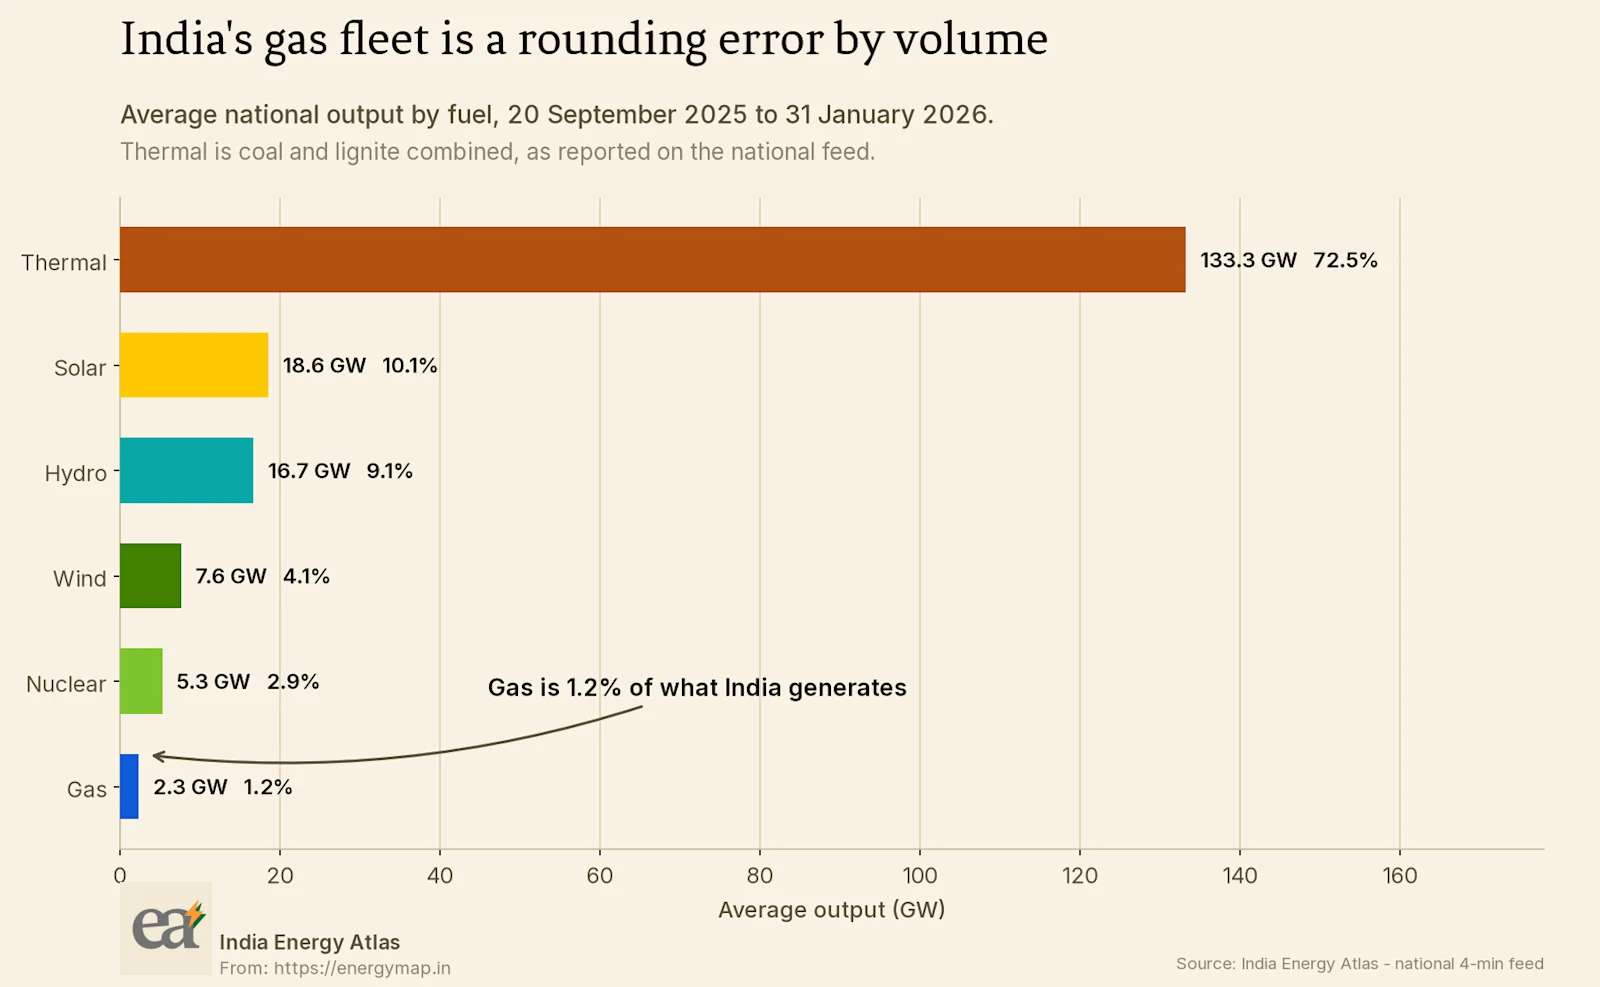
Gas is a little over one per cent of what India generates. Thermal generation, which is coal and lignite, is roughly three-quarters. On a purely volumetric reading, a complete loss of gas-fired generation would be a manageable event for the Indian grid in a way it would not be for Japan, Korea or much of Europe.
If the question were only how many units are at risk, I could stop here and the answer would be reassuring.
Gas is also the hour that matters #
Volume is only half the question, because electricity is priced at the margin. The timing of gas dispatch carries more information than its quantity.
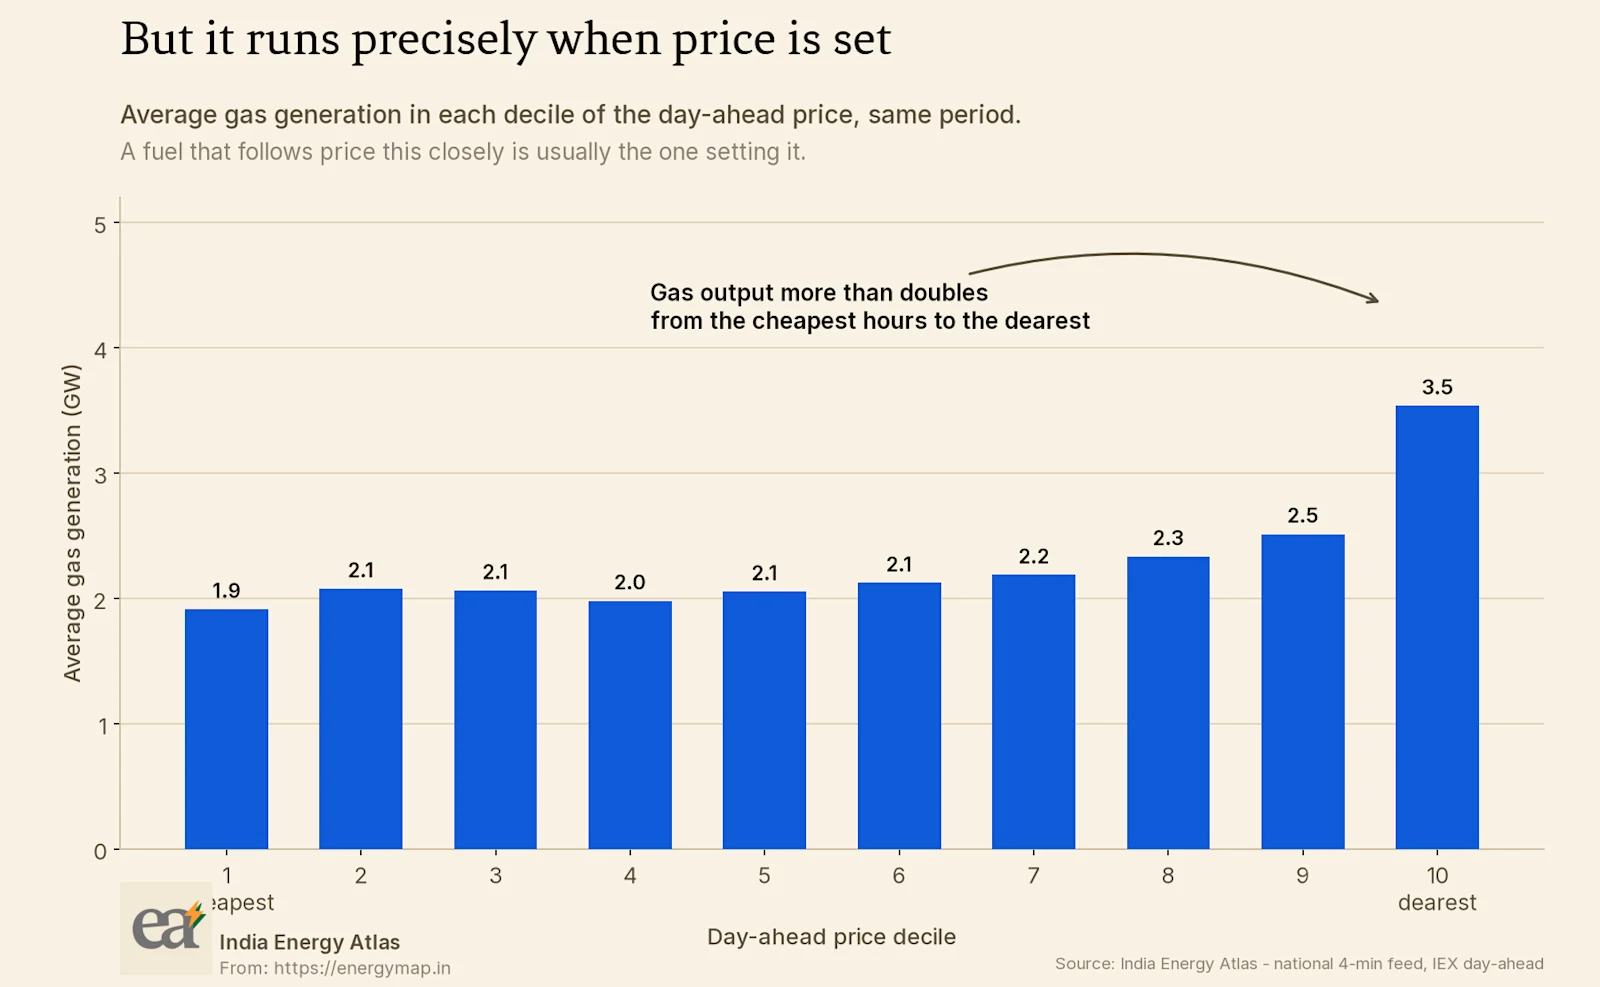
Sorting every hour of the period into deciles of the day-ahead price and averaging gas output within each decile produces a clean monotonic relationship. Gas output in the most expensive tenth of hours is more than double its output in the cheapest tenth. That pattern is what a marginal unit looks like. Gas is dispatched into the hours when the system is tight and stood down when it is not.
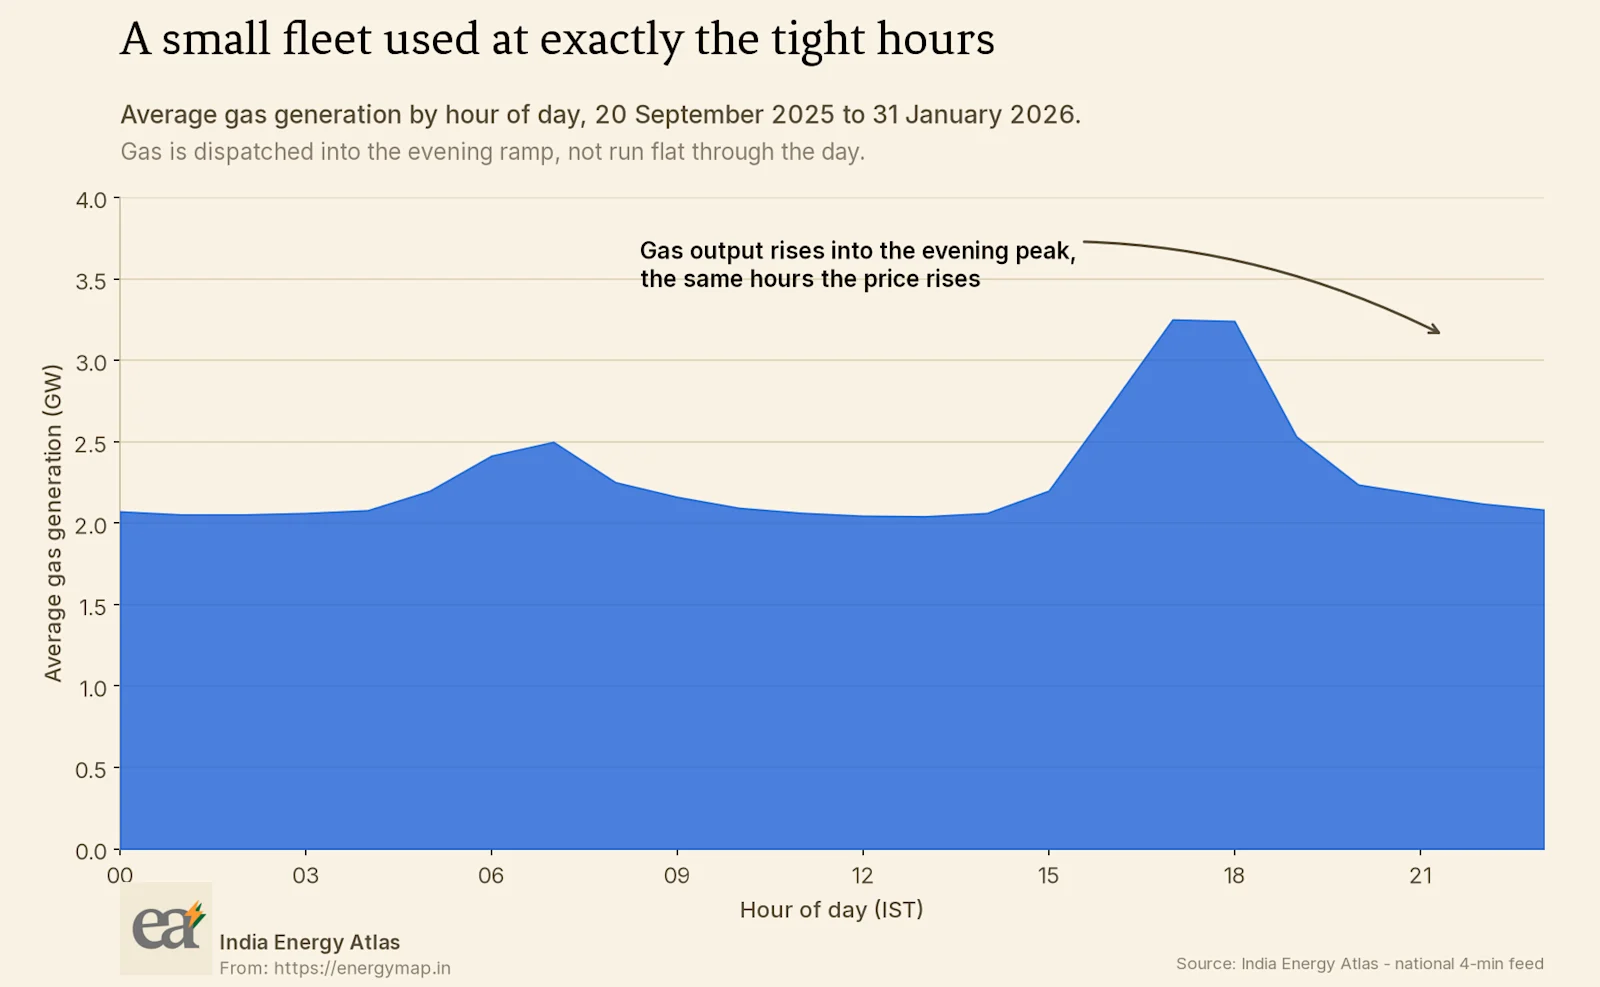
The hourly profile says the same thing from a different angle. Gas output rises into the evening, which is precisely the block where solar has gone to zero and where, as I have written previously, the clearing price has held its value while midday prices have collapsed.
A fuel can be one per cent of the energy and a much larger share of the price.
What I can and cannot conclude #
I am confident about the correlation between gas output and price. I am less confident about the direction of causation in any given hour, and the data I have cannot settle it. Gas may be setting the price in those hours, or gas may simply be responding to a price set by expensive coal or by scarcity. Establishing which would require the actual merit order and unit-level bid data, which I do not have.
I also cannot quantify the pass-through from a Hormuz closure to an Indian clearing price. That calculation needs the delivered cost of alternative cargoes, contractual structures for existing long-term supply, the willingness of state buyers to pay spot rates, and the elasticity of gas-fired dispatch to fuel cost. Those inputs exist, but not in this dataset. I do not know the number, and I would treat with suspicion anyone who states it confidently without showing that chain.
What I will say is that the shape of the exposure is different from the shape most people assume. The volumetric loss would be small. The effect would land on the hours where India has the least slack, and it would land alongside every other pressure that already concentrates there.
What would change my reading #
I find it useful to state in advance what evidence would overturn a conclusion, because it disciplines how strongly the conclusion is held.
Three observations would make me abandon the marginal-unit reading of this data. If gas output turned out to be driven mainly by a small number of plants operating under must-run obligations tied to industrial steam supply, the correlation with price would be incidental. If the correlation disappeared once controlled for hour of day, it would mean I am observing a shared daily rhythm rather than a dispatch response. And if the top price decile were dominated by hours when gas was physically constrained rather than economically dispatched, the causal story would run the other way.
The second of those is partly testable in this data, and the hourly exhibit is the test. Gas rises into the evening, when price rises. It does not sit flat through the day with a level shift, which is what a must-run profile with a coincidental price correlation would look like. That is supporting evidence rather than proof.
The first and third need plant-level data I do not have.
The modelling point #
This is a good illustration of why cross-commodity modelling is worth the effort. If gas prices enter a power model as a fixed input, a fuel shock is a parameter change and the answer comes out roughly proportional to gas's share of generation. That answer would be wrong here.
A model that dispatches against a fuel cost derived from its own supply and demand balance behaves differently. When delivered gas cost rises, gas-fired units withdraw from the merit order, the marginal unit in the tight evening hours becomes something more expensive, and the price effect is larger than the volume effect. The size of that gap is exactly what a planner needs and exactly what a proportional estimate hides.
This is the sort of question the Modeler workspace exists to answer, because it lets a user vary the fuel assumption and see the dispatch consequence rather than assuming the two move together.
So what, and for whom #
For a state distribution utility. Your exposure to a gas shock runs through the exchange price in the evening block and through the states you import from, rather than through your own gas procurement, which is probably negligible. Utilities with high import dependence carry this risk indirectly. Bihar and Delhi are the clearest cases in the current data.
For a gas-fired generator. The asymmetry in this data works in your favour, and it argues for valuing the plant on the hours it runs rather than on its capacity factor. A unit that runs a small number of expensive hours a year can be worth more than its utilisation suggests.
For a trader. The relationship between gas availability and the evening clearing price is stronger than the volumetric share implies. Positions taken on the assumption that a one per cent fuel is a one per cent risk are mispriced in both directions.
For a policymaker. Strategic reserve questions for gas in India are usually framed around volume of supply. The data argues for framing them around a small number of specific hours, and around what else could serve those hours if gas were unavailable. Storage and demand response compete for the same job.
The generation series behind these exhibits is documented with the rest of the Atlas data products, and the state-level view for a gas-exposed system such as Gujarat shows how unevenly this sits across the country.
Sources & method
Measured All-India 4-minute generation feed and IEX day-ahead clearing prices, India Energy Atlas production series, 20 September 2025 to 31 January 2026. Generation shares are computed from metered output rather than installed capacity, because a large share of Indian gas capacity is idle for want of affordable fuel. Price deciles are computed over hourly means across the full period. Cover photograph by Georg Eiermann on Unsplash.