

Demand growth is the number that governs India's transition
Every complete financial year in the record shows both energy met and peak demand rising. A transition in a growing system is a different problem from a transition in a flat one.
Reading India next to the rest of Asia-Pacific #
Discussions of the Asia-Pacific energy transition tend to group markets by their decarbonisation commitments. Grouping them by what their demand is doing produces a more useful picture, and it puts India in a category with very few members.
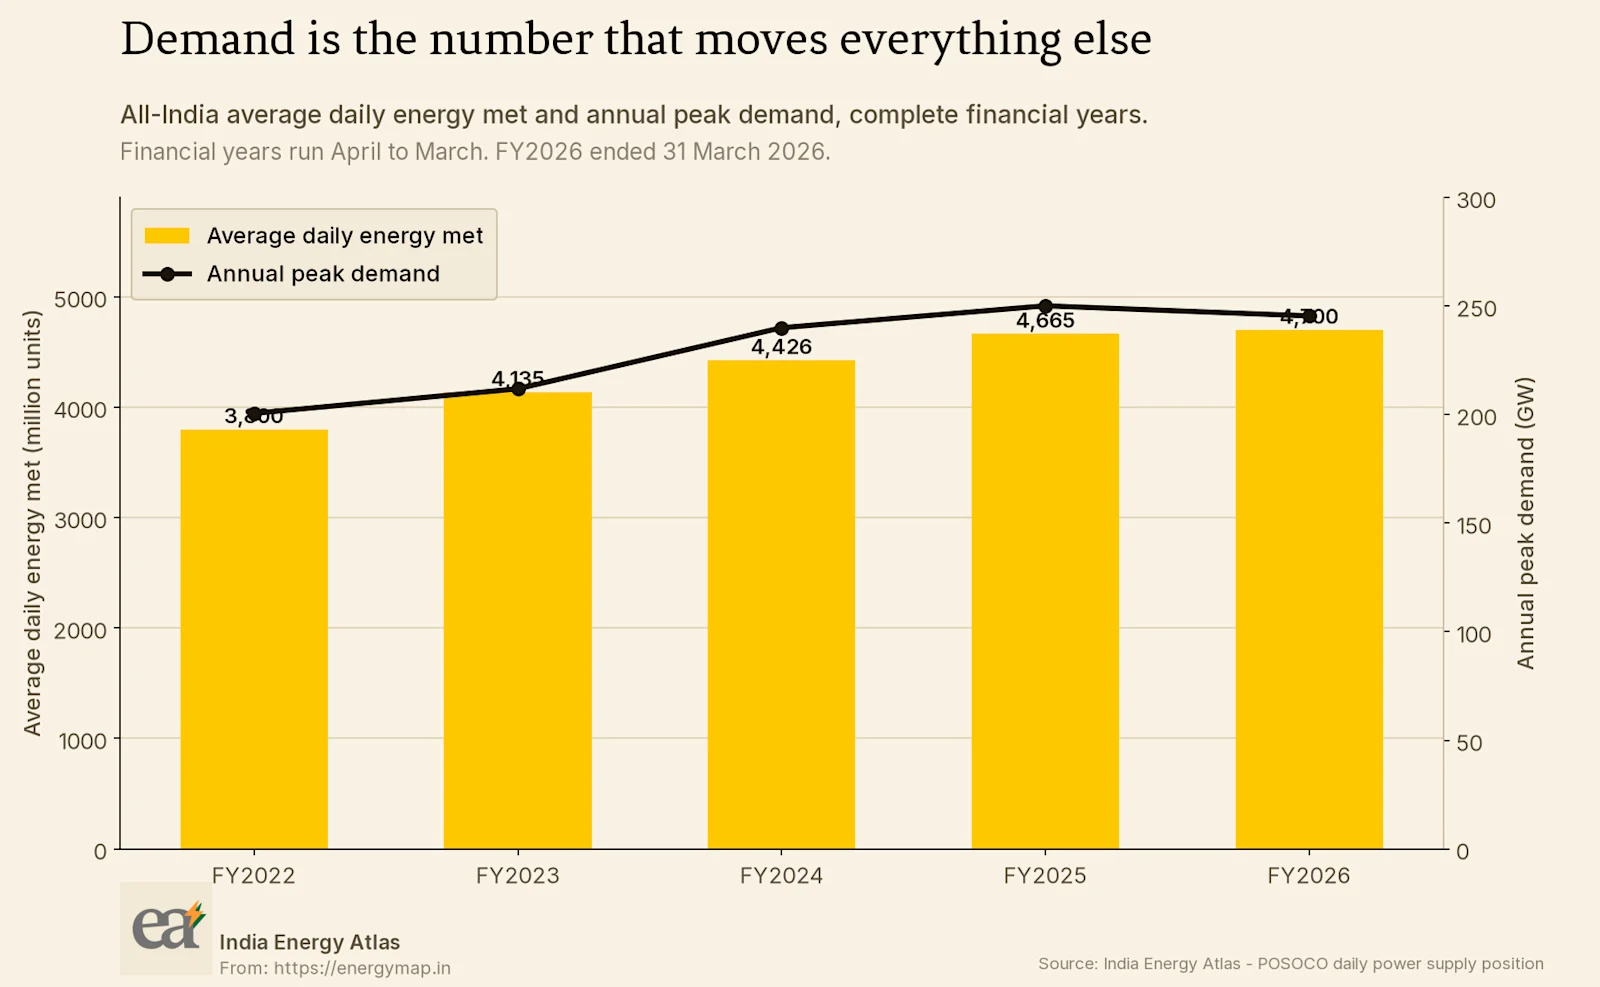
Average daily energy met and annual peak demand have both risen in every complete financial year in this series. The peak has moved by a wide margin over five years. For most systems in the region the equivalent chart is flat or declining, and a transition in a flat-demand system is a substitution problem. Old capacity retires, new capacity replaces it, and the argument is about sequencing.
India is not running that problem. Every unit of clean capacity added has to serve growth before it displaces anything.
What that means for the fuel mix #
The consequence shows up directly in the generation stack.
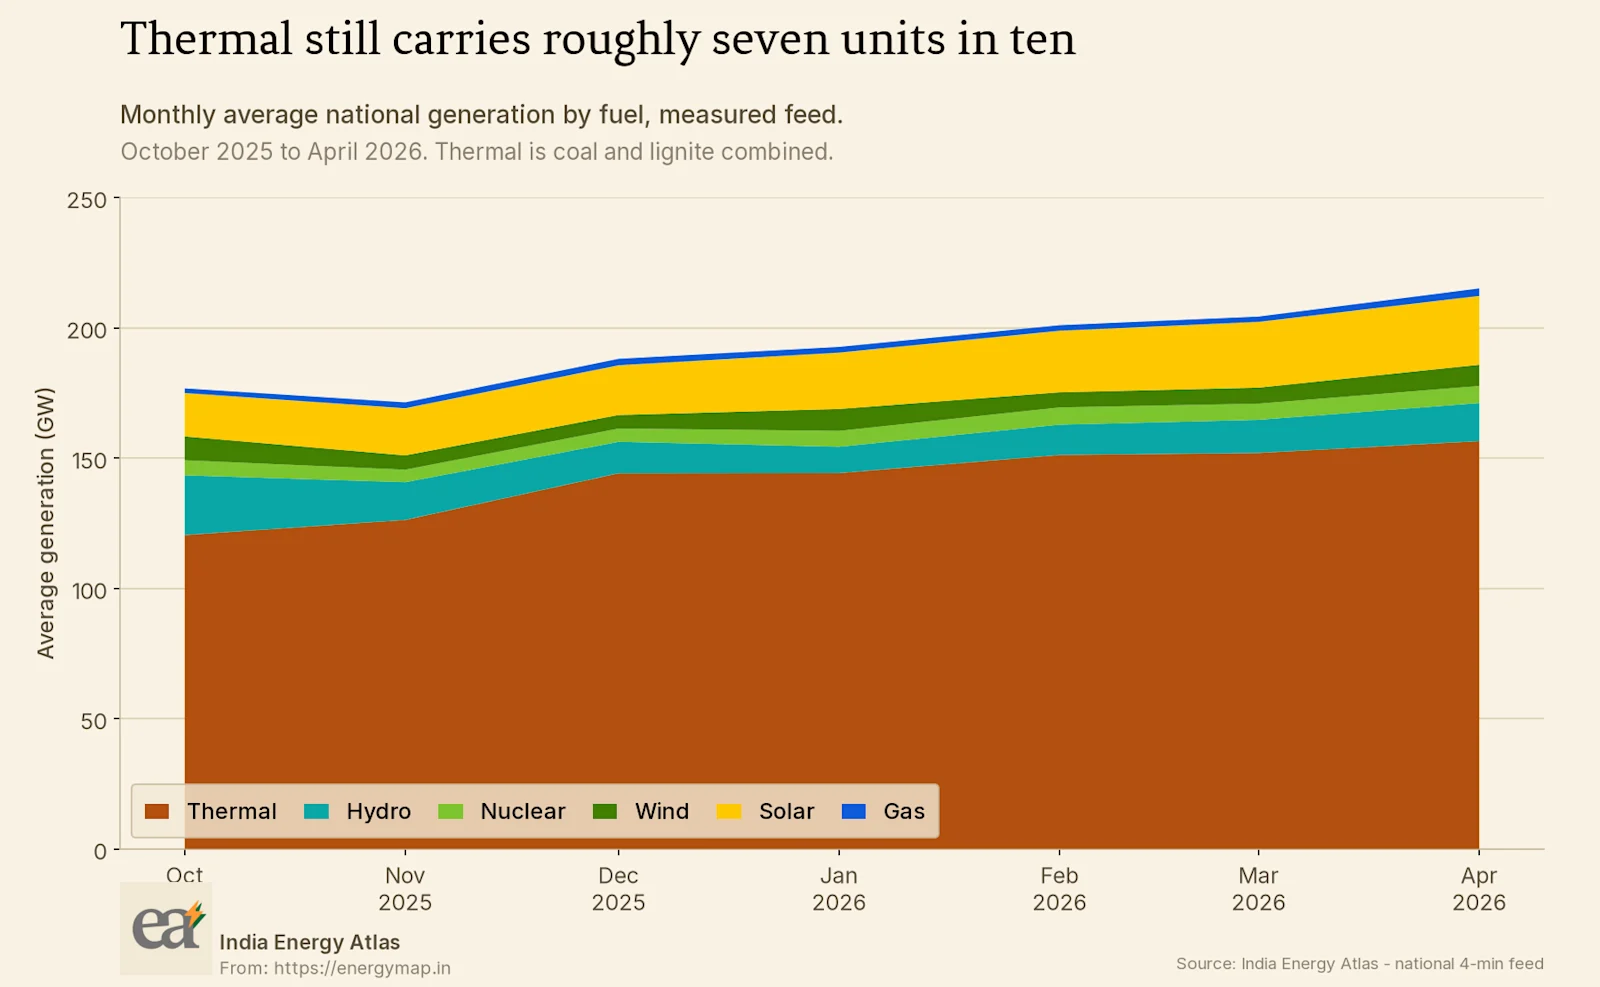
Thermal generation, which is coal and lignite, still carries roughly seven units in ten. That share has fallen slowly while the absolute quantity of thermal generation has risen, because the denominator has grown faster than the substitution.
I want to be careful here, because this is a place where I can only partially support the claim I would like to make. I would like to give a clean multi-year series of coal's share of Indian generation. The long-run per-fuel series available to me has incomplete coverage across the full period, with different fuels reported by different upstream sources at different times, and constructing a share from it would produce a trend that reflects reporting changes as much as physical changes. I have not published that trend, because I do not trust it. The seven-month window above uses a single consistent measured feed, and I am confident in it.
A transition in a growing system is arithmetic before it is policy.
The three things that follow #
Storage decisions are timing decisions. In a flat system, storage is sized against the gap between existing generation and existing load, and getting it slightly wrong is recoverable. In a growing system with a deepening midday solar trough, the size of the job changes every year the decision is deferred. The states carrying the steepest evening ramps, which I have written about separately, face this most acutely.
Planning for the average is planning for the wrong year. A demand series rising at this rate means the average year in a five-year plan is not a year the system will ever experience. The plan has to be evaluated against the end year and against the years in between, which is a scenario problem rather than a forecasting problem.
Reliability and decarbonisation have stopped being the same project. For a period they moved together, because new renewable capacity added both clean energy and capacity. As the midday trough deepens, additional unfirmed renewable capacity adds energy without adding much capability in the hours that determine reliability. The two objectives now require different investments, and a plan that treats them as one will under-deliver on both.
The composition question underneath the growth #
Aggregate demand growth is a single line, and it conceals a compositional question that matters more for planning than the total does.
Growth arriving as air conditioning in existing residential connections has one profile. Growth arriving as industrial load in a new corridor has another. Growth arriving as electric vehicle charging has a third, and its shape depends heavily on whether charging happens at workplaces during the day or at homes in the evening. Each of these produces the same number on the chart above and a different requirement for the system.
I can observe the aggregate cleanly. I cannot decompose it into these categories with the data available to me, because metered consumption by end use is not published at the resolution that would allow it. What I can observe indirectly is the shape of the load, and the shape has been changing in a direction consistent with cooling-driven growth, with summer days becoming flatter as demand rises.
That indirect inference is weak evidence and I would not build a capacity plan on it. The stronger point is that a demand forecast expressed only as a total is missing the variable that determines what capacity has to be built to serve it. A planner who knows the total and not the composition knows less than the confidence of the number suggests.
Where the regional comparison actually helps #
The parts of the Asia-Pacific experience that transfer to India are the operational ones. Queensland's experience with rooftop solar compressing the space available for synchronous generation is directly relevant to Rajasthan and Gujarat. The Australian work on modelling storage against many historical weather years rather than one typical year is methodologically transferable regardless of the demand trajectory.
The parts that do not transfer are the strategic ones. A coal phase-out schedule designed for a system with flat demand and surplus capacity does not map onto a system adding demand at this rate. I would treat any recommendation that arrives with a retirement timetable attached, and without a demand growth assumption stated alongside it, as untested.
So what, and for whom #
For a national planner. Demand growth is the assumption that most affects every other number in the plan, and it deserves the largest share of the sensitivity analysis. A plan that is robust to a wide range of clean capacity outcomes but assumes a single demand path is fragile in the wrong place.
For a developer. Growth of this kind means the addressable market is expanding, and it also means the value of a marginal unit depends heavily on which hour it arrives in. Both effects are real and they point in different directions for unfirmed solar.
For a regulator. Approving capacity against a demand forecast that has been revised upward repeatedly is a known failure mode. The useful discipline is to check the forecast against realised growth each cycle and to publish the error.
For an international analyst. Applying a template built for a flat-demand market to India will produce recommendations that are internally consistent and practically wrong. The demand assumption is the first thing to check in any imported analysis.
The daily supply position series and the measured generation feed are both published through the Atlas data products, and the state-level view for a fast-growing system such as Uttar Pradesh shows how unevenly this growth is distributed.
Sources & method
POSOCO daily power supply position for All-India, financial years 2022 to 2026 complete years only, and the measured All-India 4-minute generation feed for October 2025 to April 2026. Financial years run April to March. The generation stack uses a single consistent measured feed; a longer per-fuel series was examined and rejected because upstream reporting composition changes over the period would contaminate any share trend computed from it. Cover photograph by Anish De on Unsplash.