

Seven things India's 2026 operating record says about grid planning
A continuous four-minute record of Indian demand and generation contains seven findings that should change how a planning study is scoped. Six of them are invisible at hourly resolution or coarser.
What a year of measured data says #
I have spent the past several months working through a continuous four-minute record of Indian demand and generation. Below are the seven findings from that record that I think should change how a planning study is scoped. Some of them are confirmations of things people already assumed. Two of them surprised me.
One. The dispatchable fleet performs an enormous swing every day #
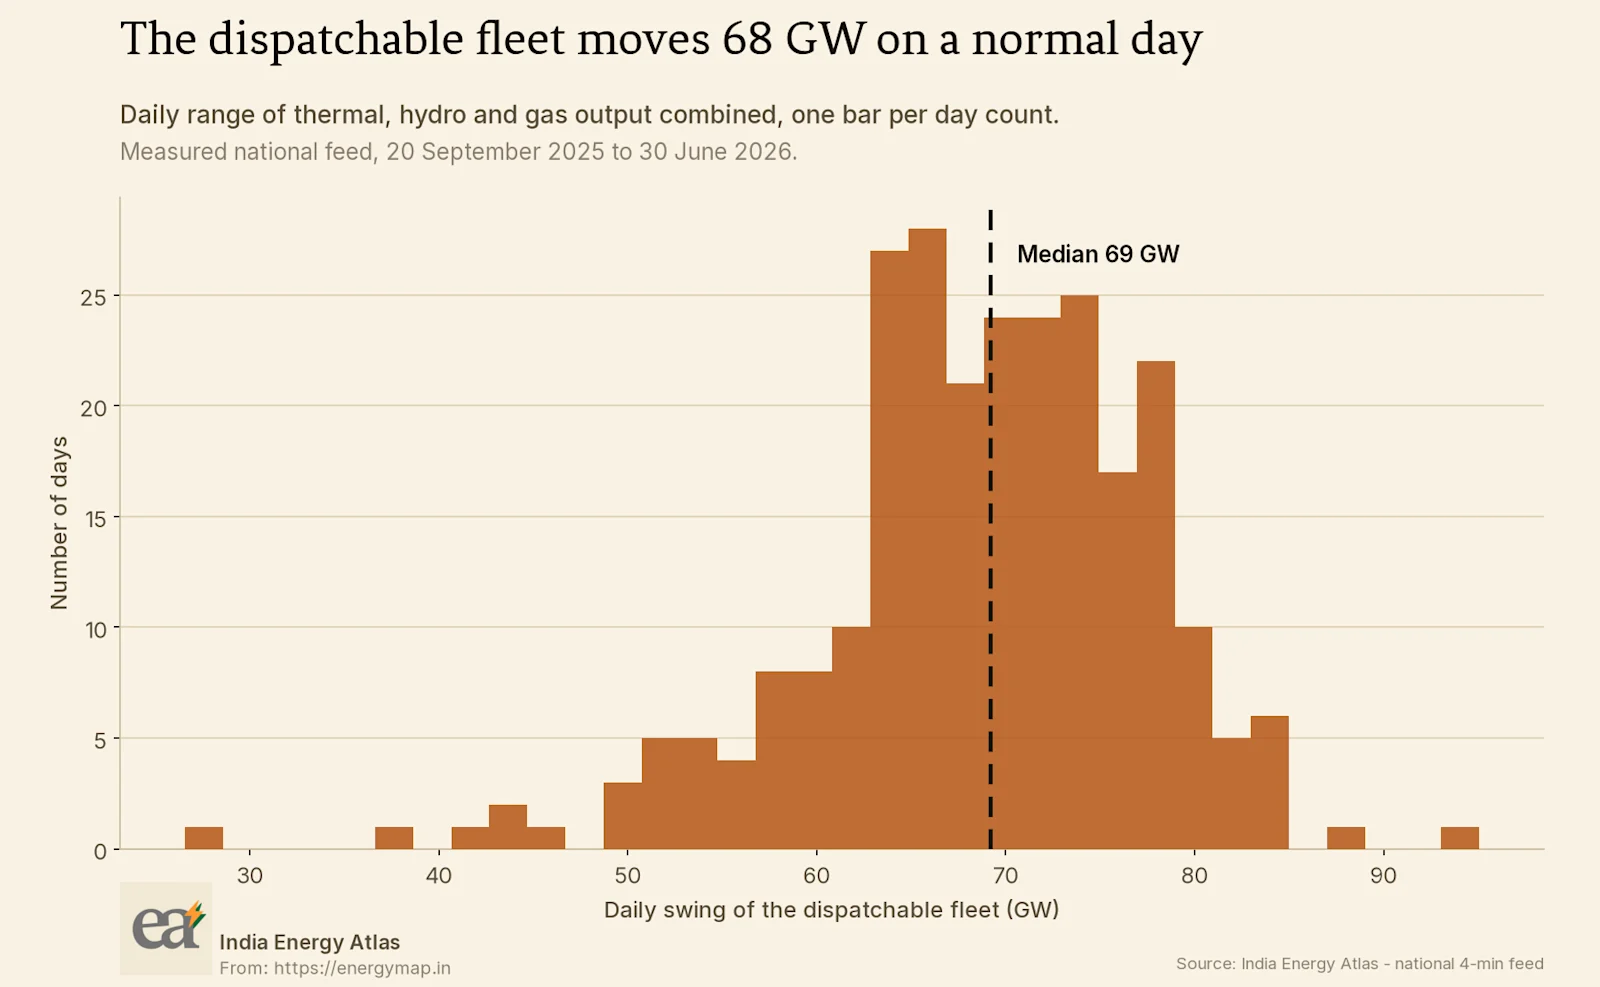
The daily range of thermal, hydro and gas output combined is very large on a typical day, and the distribution has a long right tail. This is a routine operational requirement rather than an exceptional event.
Planning studies frequently report capacity adequacy and rarely report the ramp the fleet is asked to deliver. On this evidence, the ramp is the more binding of the two and it is getting larger.
Two. The daily peak moves through the year by many hours #
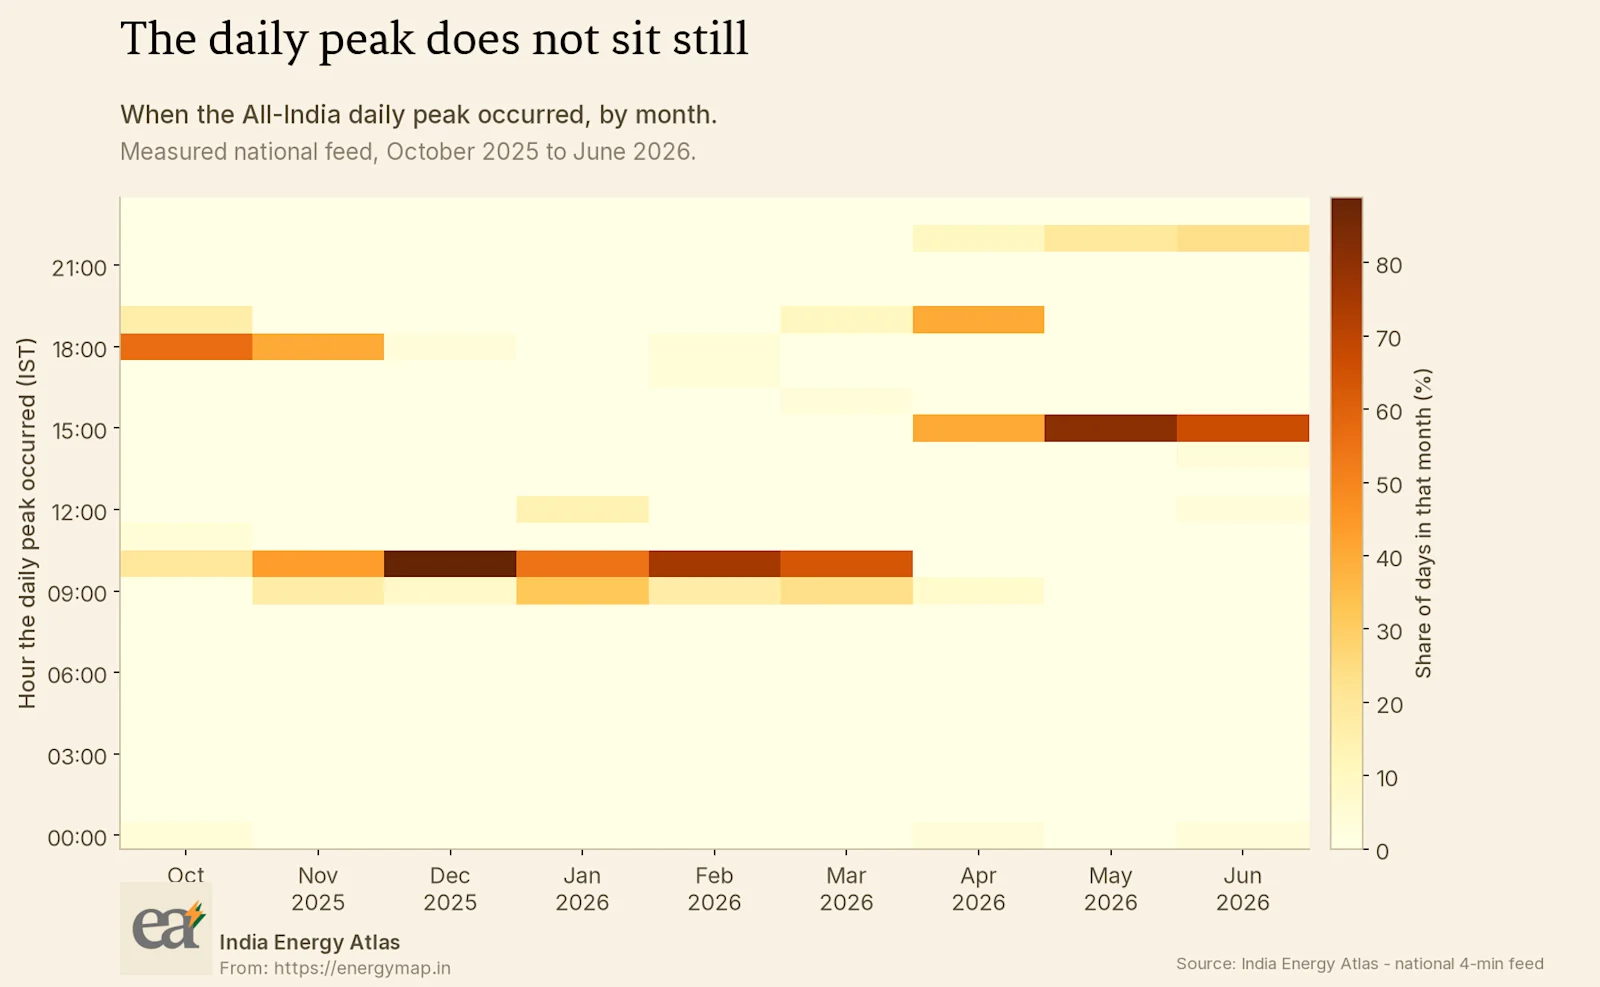
I expected some seasonal drift in the timing of the daily peak. I did not expect it to move as far as it does. Through winter the peak sits in the morning. Through summer it sits in the middle of the afternoon, with a second cluster late in the evening.
This has a direct consequence for any analysis that uses a fixed peak hour. Time-of-day tariff blocks, capacity obligations and contract structures written around an evening peak describe the system accurately for part of the year and inaccurately for the rest of it.
Three. The summer day is flatter than the winter day #
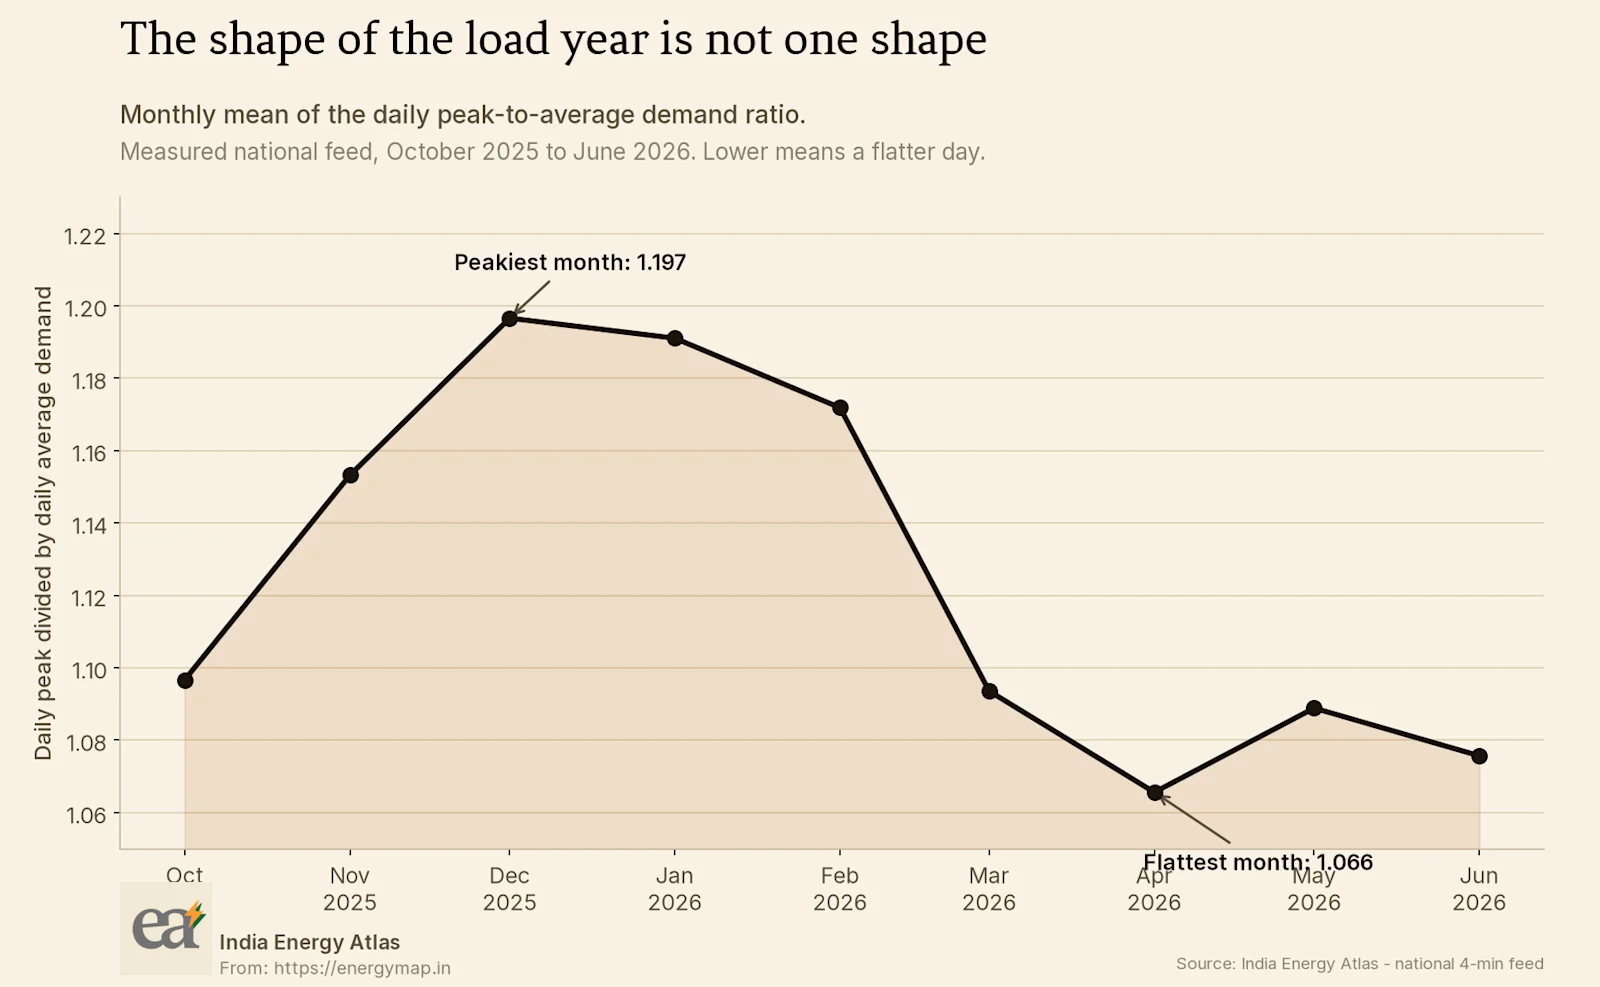
This was the finding I found most counter-intuitive. The ratio of the daily peak to the daily average is lowest in the summer months, when absolute demand is highest, and highest in winter.
The explanation is straightforward once seen. Summer demand is dominated by cooling, which runs through the day and into the night. Winter demand has a smaller base and a sharper evening concentration. High absolute demand and peaky demand are different conditions, and the months that produce each are not the same months.
Four. Solar's share at midday is now large enough to change the merit order #
At the middle of the day solar supplies roughly a third of national generation. That is sufficient to displace the marginal thermal unit for a block of hours, which is why midday clearing prices have fallen so far.
Five. Gas is small in volume and disproportionate in influence #
Gas is a little over one per cent of generation and its output correlates strongly with price. A fuel that behaves this way is worth modelling explicitly rather than netting into a thermal aggregate.
Six. The states have diverged enough that a national average describes none of them #
Net load profiles at state level range from close to flat to deeply negative at midday. A national resource adequacy conclusion applied uniformly will over-provision in some states and under-provision in others.
Seven. Reported averages hide the tails that determine reliability #
The coal stock average is the clearest case. The relationship between the average and the number of plants actually short is non-linear, and it steepens exactly where it starts to matter.
Six of these seven findings are invisible in annual or monthly aggregate data. They only appear at operational resolution.
Why resolution is the binding constraint #
The common thread through these findings is that they are properties of the intra-day shape, and the intra-day shape is exactly what aggregation destroys.
A daily total conceals the ramp entirely, because a flat day and a violently swinging day with the same energy produce identical daily figures. An hourly average smooths the fastest part of the evening transition, which is where the operational difficulty concentrates. A monthly average of an hourly profile conceals the day-to-day dispersion, so a month containing several very difficult days and many easy ones looks moderate throughout.
This has a practical implication for how analytical capability is built. A great deal of effort in the sector goes into extending the horizon of models, running twenty-year capacity expansions and long-dated scenario sets. Comparatively little goes into increasing the resolution at which the near term is examined. On this evidence the second is where the unexamined findings are.
The two are also linked. A capacity expansion model calibrated against a system whose ramp requirement is understated will under-build flexibility for twenty years, and the error compounds. Resolution in the calibration determines the quality of the long-horizon answer.
What I could not establish #
I want to be clear about the limits of this exercise.
I could not construct a reliable multi-year series of coal's share of national generation, because the long-run per-fuel data available to me changes composition over time in ways that would contaminate the trend. I have not published one.
I could not determine how much dispatchable headroom the system holds at its tightest hours, because that requires unit-level declared capability rather than metered output.
I could not separate curtailment from low renewable availability in the state-level data, which limits what I can say about how much clean energy is being wasted at midday. I do not know that number.
So what, and for whom #
For a modelling team. Three of these findings, the ramp magnitude, the peak hour drift and the seasonal load factor reversal, are only visible at sub-hourly resolution. If your study runs at hourly or daily granularity against typical days, it is not capable of producing them.
For a planner. The adequacy criterion, the tariff block definition and the maintenance schedule all currently assume a fixed intra-day shape. All three are candidates for restatement against a shape that varies by month.
For a regulator. Time-of-day tariff blocks fixed year-round are misaligned with the system for a substantial part of the year. Realigning them seasonally is a low-cost change with a measurable effect on load shape.
For an executive. The useful question is which of these seven your current analysis would have surfaced. Most conventional workflows would surface two or three.
The measured national feed behind all three exhibits is published through the Atlas data products, a study of this kind can be reproduced against live data in the Modeler workspace, and the state-level versions for Rajasthan, Gujarat and Uttar Pradesh diverge from the national picture considerably.
Sources & method
Measured All-India 4-minute demand and generation feed, India Energy Atlas production series, 20 September 2025 to 30 June 2026. Monthly figures use months with substantially complete coverage. Peak hour is computed from hourly means of the 4-minute record. The load factor measure is the daily maximum divided by the daily mean, averaged within each month. Cover photograph by Dmitrijs Safrans on Unsplash.