
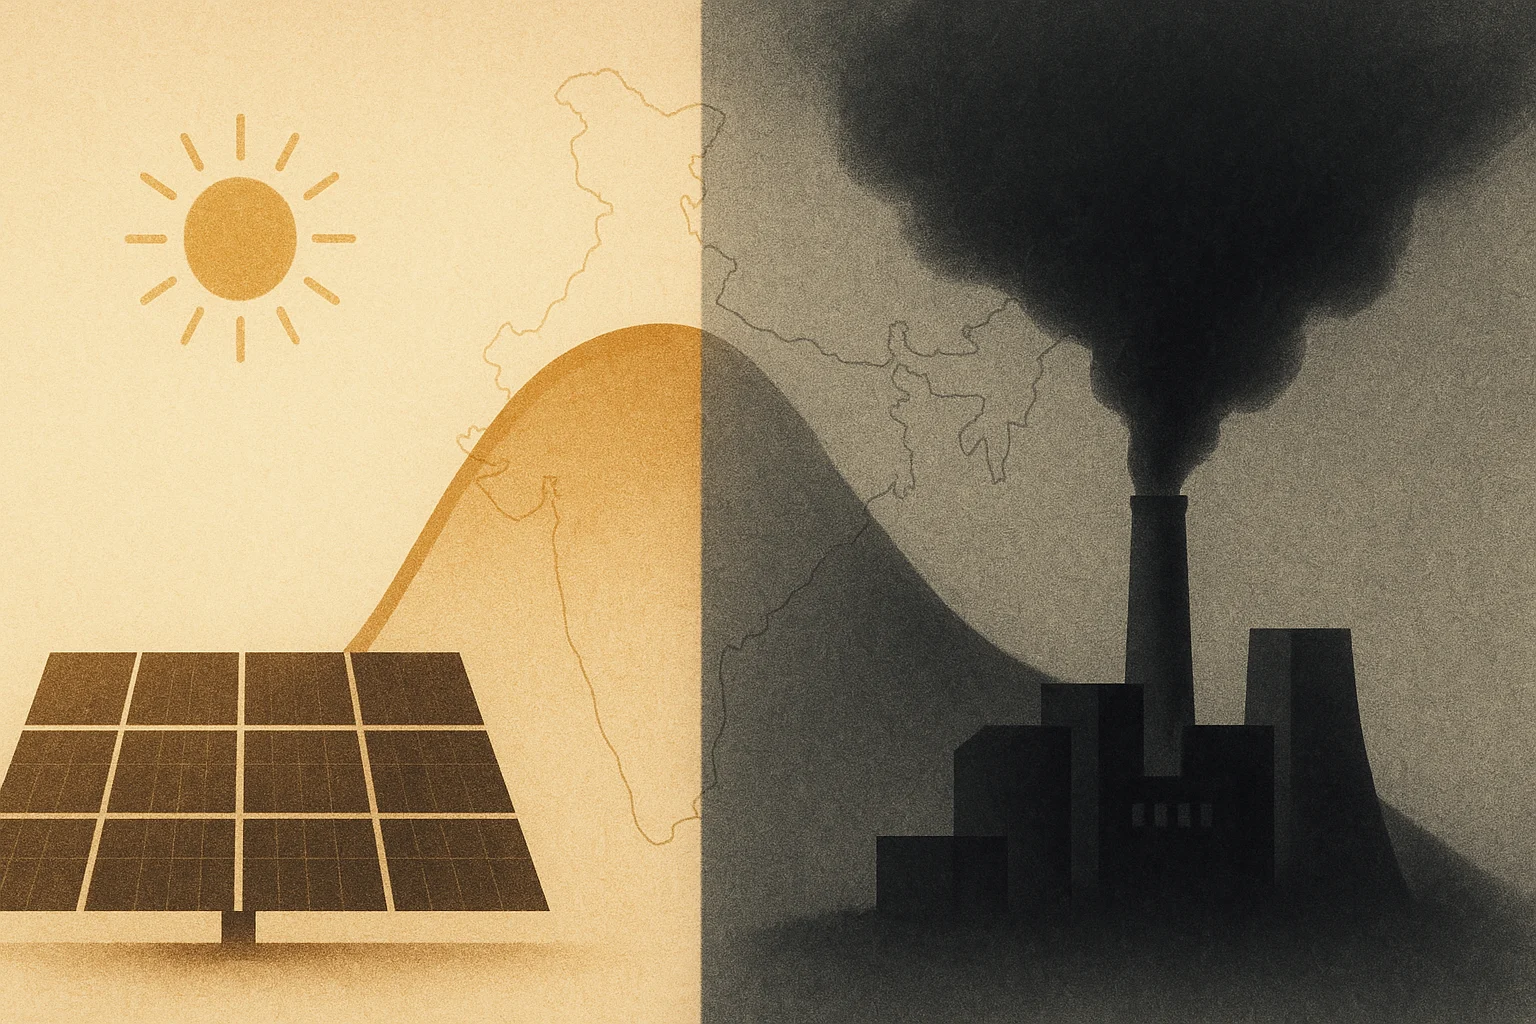
Two grids, one morning: a solar state beside a coal state
At 10 a.m. Rajasthan was running on 100% solar and West Bengal on 77% coal — the same four charts, two completely different machines, and an honest twist in the carbon.
Put two Indian state grids side by side on the same morning and you are looking at the same instruments — the same demand curve, the same stacked fuel mix, the same running carbon tally — wired to two completely different machines. This is a reading of one such morning: Rajasthan, which by ten o'clock was running on sunshine, next to West Bengal, which was running, as it almost always is, on coal.
The point is not to crown a winner. It is that the shape of a grid's day tells you more than any headline number — and that the headline number, read carelessly, will point a planner, an investor or a regulator at exactly the wrong lever. By the end of this you should be able to look at four live charts and say not just what each grid is, but what each one would have to change, and who should pay to change it.
The solar state at ten in the morning #
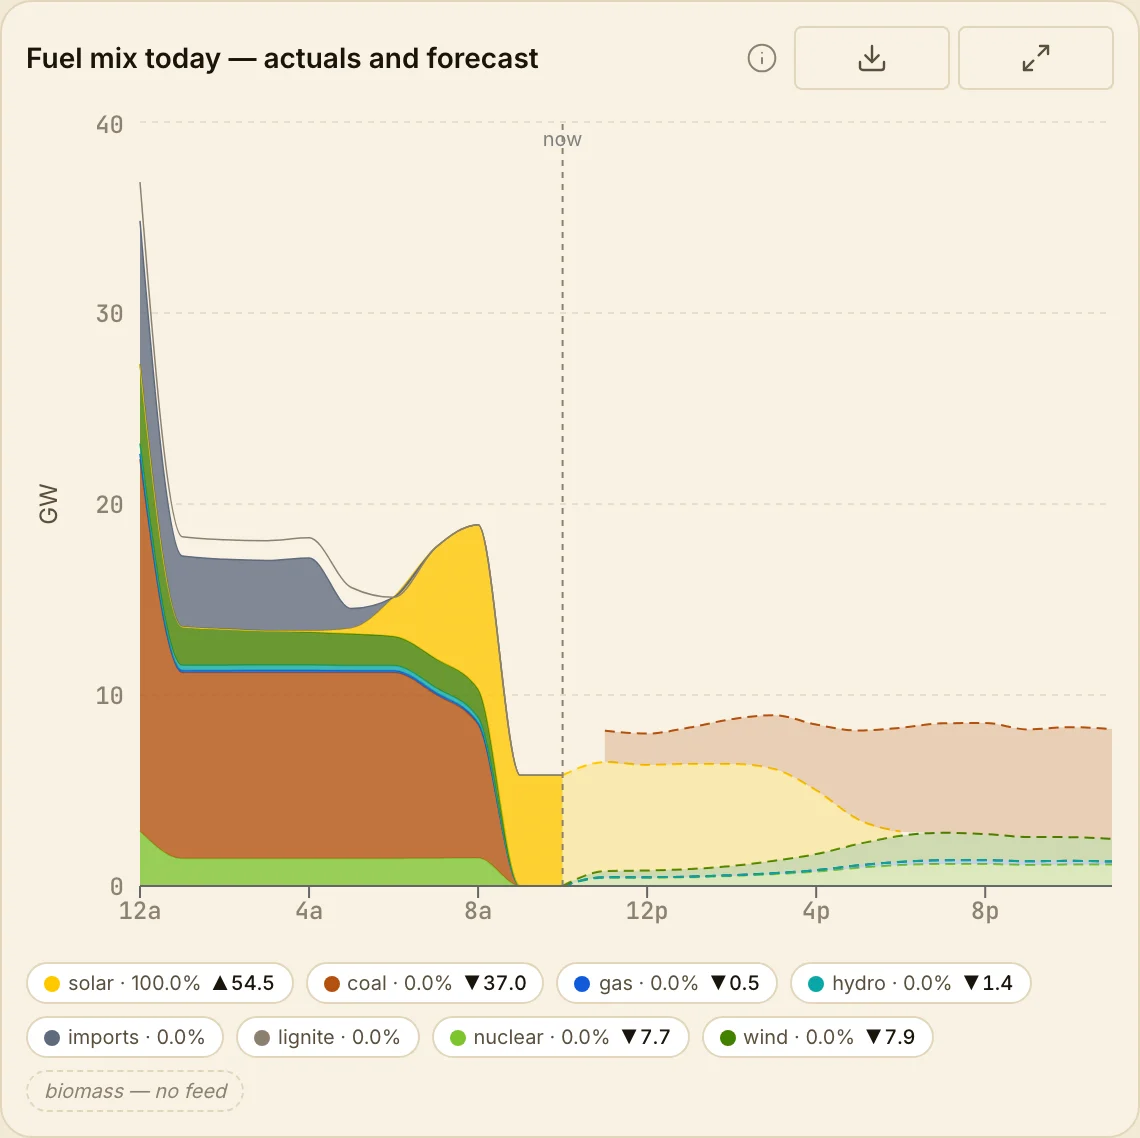
Rajasthan's fuel mix at the "now" line is almost comic in its simplicity: solar, 100%. Coal, gas and hydro have all been throttled to zero for the middle of the day. Read leftward from that line, though, and the honesty of the picture returns. Through the small hours the same grid was a coal grid — a thick brown band carrying roughly 11–12 GW from midnight to dawn. Then the sun came up, thermal was backed down hour by hour, and by mid-morning the desert was meeting its own load, and then some, out of a stack made entirely of photons.
That is not a gentle midday dip. It is a near-total handover, twice a day, and it makes Rajasthan the most operationally interesting grid in the country to watch between 8 a.m. and 4 p.m. — the machine visibly changes character on a schedule you can set your watch by. It is also a warning label. Everything good about that solar noon is undone six hours later, when the sun leaves and the coal has to come back to meet the evening peak. The state has solved the middle of the day and not yet touched the ends of it.
The coal state, flat as a table #
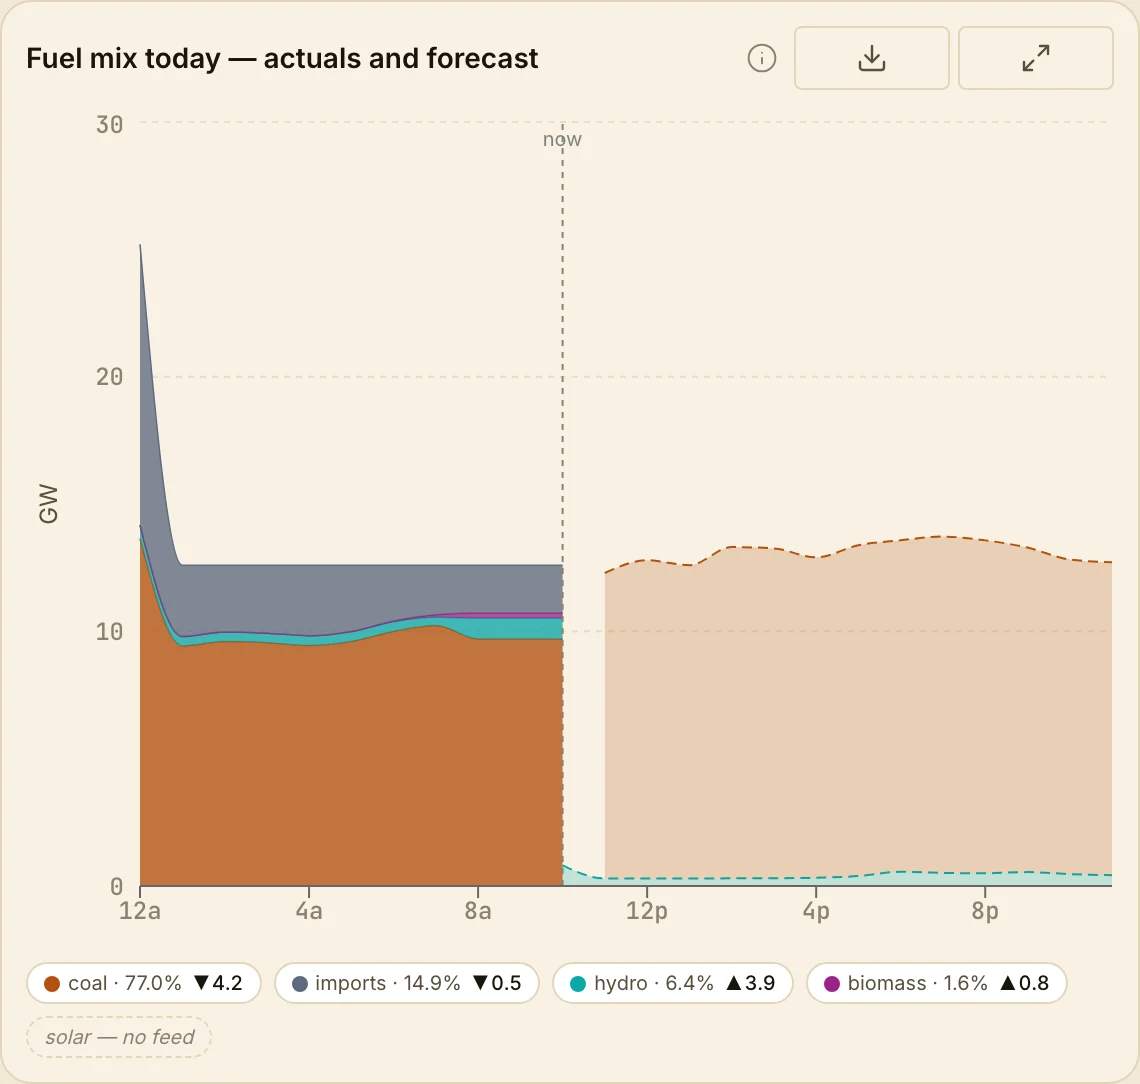
Now West Bengal, and the contrast could not be starker. At the same "now" the mix reads coal 77%, imports about 15%, a little hydro and biomass — and the tell: solar, no feed. The coal band is not a curve at all; it is a plateau, a near-flat slab that carries the state from midnight to midnight and barely registers that the sun rose. The evening peak is met the same way as the 3 a.m. trough: burn more of the same, or pull a little harder on imports.
Where Rajasthan's chart is a story of transformation, West Bengal's is a story of constancy — and that constancy is structural, not accidental. An eastern grid sitting on the country's coal belt, with modest wind and solar resource, does not have a midday trough to build a flexibility strategy on. Its 15% import share is doing quiet work here: it is the closest thing this grid has to a flexible resource, and it is bought, not built.
The honest twist is in the carbon #
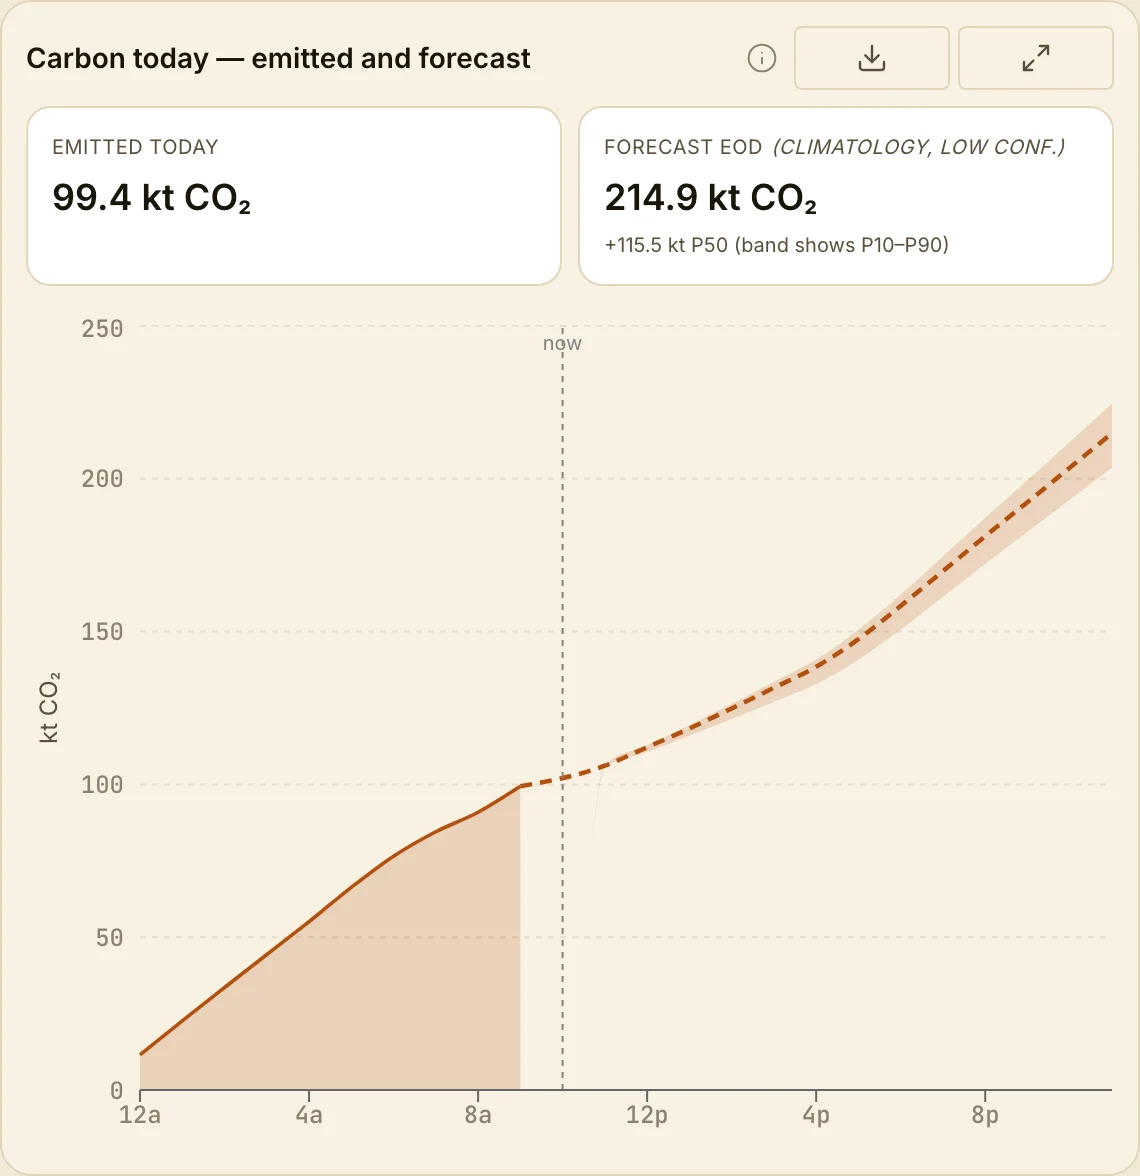
Here is where the careless reading goes wrong. If solar-rich Rajasthan is running clean by noon, surely it emits less than coal-bound West Bengal? The running tally says the opposite. Rajasthan had already emitted 99.4 kt of CO₂ by mid-morning and is on track for roughly 215 kt by day's end.
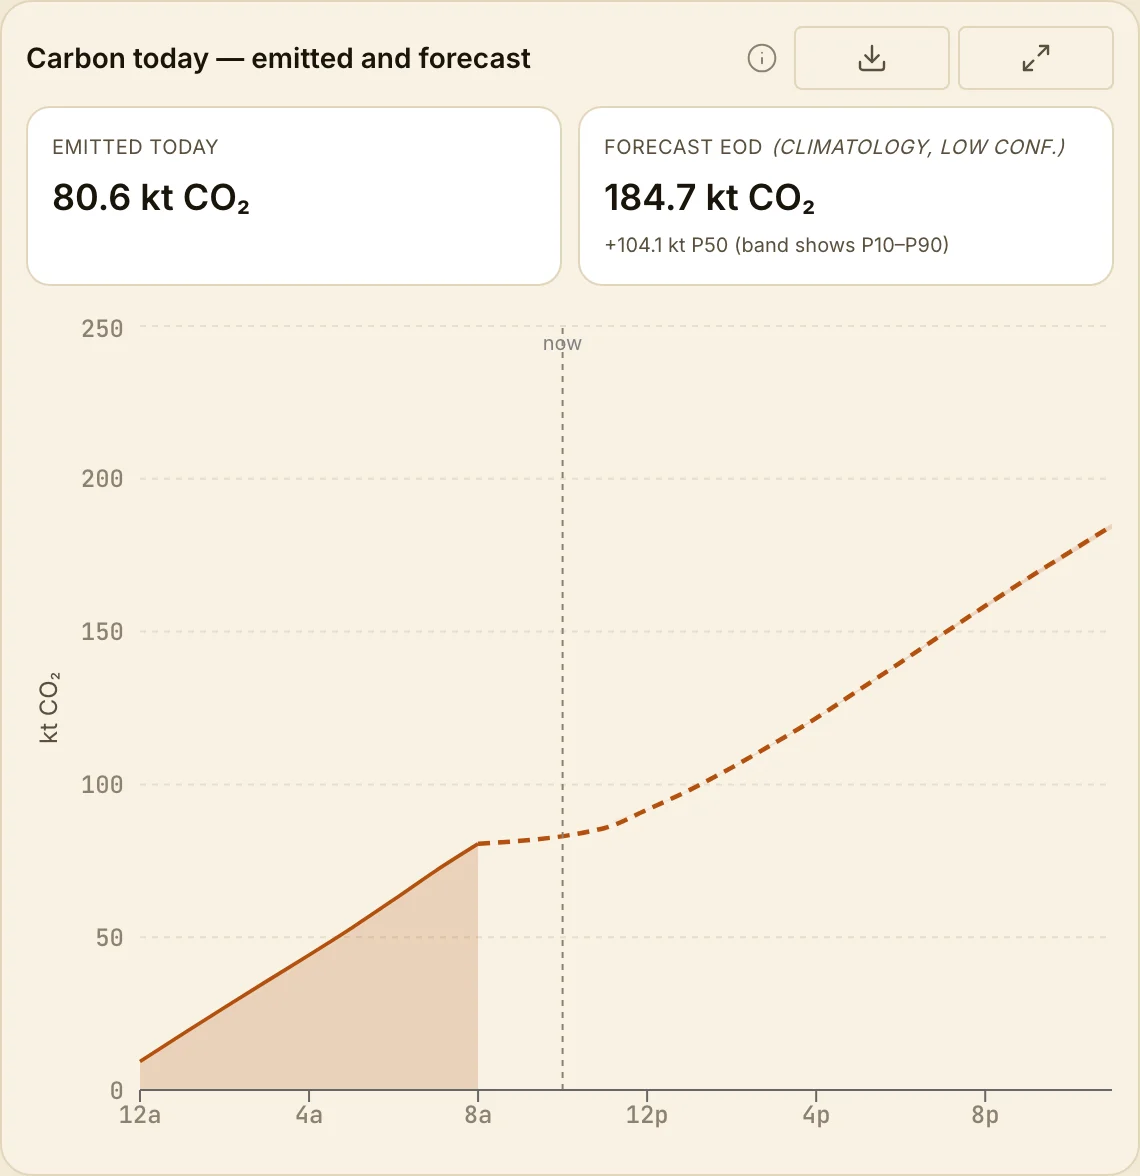
West Bengal, on the same clock, sat at 80.6 kt, heading for about 185 kt. The solar state, on this day, is the larger emitter — by something like 15%.
Two things reconcile the paradox, and both matter for anyone who quotes these numbers. First, Rajasthan is simply a bigger machine with more demand to serve, so even a spotless midday rides on top of a large coal night. Second — and this is the part that trips up policy decks — the "carbon today" chart counts tonnes accumulated, not grams per kilowatt-hour. Those are different questions with different answers, and the intensity answer is where the solar dividend lives.
A grid's decarbonisation is not one number going down. It is a shape changing — and the shape tells you where to put the next gigawatt of flexibility.
Watch the shape rather than the height and the dividend reappears. Rajasthan's cumulative curve visibly eases through the middle of the day — a shelf where the sun is doing the work and almost no carbon is being added — before the slope resumes at dusk. West Bengal's line has no shelf. It is a straight ramp, because the thing doing the emitting never clocks off. Same chart, same axis; one grid has a midday reprieve and the other does not. The carbon-intensity methodology sets out the two conventions in full; confuse total emitted with intensity and you will draw the wrong conclusion from the right chart.
So what — where the next gigawatt of flexibility goes #
The reason to read the two shapes together is that they are, quite literally, a map of where flexibility pays. Four readers should act on them differently.
The system planner and the DISCOM. In Rajasthan the leverage is temporal, and it is enormous. The state has a daily window of surplus, near-zero-carbon power sitting in the middle of the afternoon. Every unit of demand you can move into that window — industrial process load, agricultural pumping, EV-depot and bus charging, and eventually electrolysis — is served almost for free and almost carbon-free, and it flattens the brutal evening ramp on the way. The planner's job in Rajasthan is a load-shifting job. In West Bengal there is no trough to shift into, so flexibility earns its keep differently: storage and demand response there are about firming and reserve, not arbitrage, and the honest near-term lever is cleaning up what the coal fleet already runs rather than pretending a midday solar shelf exists.
The developer and the IPP. The two shapes price a battery completely differently. Rajasthan's deep midday trough and steep evening ramp are an arbitrage machine — charge on surplus solar, discharge into the peak — and the spread is wide enough to underwrite four-hour storage on merchant economics that simply are not available on West Bengal's flat curve. A developer reading these charts is reading a site-selection map: the same asset earns its return in Rajasthan and earns a capacity payment in West Bengal.
The regulator. The "sun sets" problem is a policy problem before it is an engineering one. Rajasthan's chart is the argument for time-of-use tariffs and a storage mandate in one image: the state is already curtailing or exporting cheap noon power it cannot yet time-shift. And the tonnes-versus-intensity distinction is not academic — a target written in total emissions rewards a small dirty grid and punishes a large decarbonising one, while an intensity target does the reverse. Which convention you legislate decides which of these two states looks like it is winning.
The trader and analyst. The intraday shape is the price shape. A grid that swings to 100% solar by noon drags its clearing price down with it, and pulls it sharply back for the evening ramp; the same event shows up on the IEX market forecasts as a midday collapse and an evening spike. West Bengal's flat generation gives a flatter price. If you trade the intraday spread, Rajasthan is the interesting book and West Bengal is the hedge.
The shape is the strategy #
Read the four charts in order and the lesson arranges itself. Rajasthan already has the shape the whole country is chasing — a deep midday trough where clean power is not merely available but surplus — and its unfinished business is time: the sun sets, and the coal night is still there. West Bengal has no trough to build on yet; its unfinished business is structure. A third state like Gujarat, which pairs a large coal fleet with a fast-growing solar one, sits between the two and shows the transition caught mid-stride.
So the same instruments give two different machines — and a carbon number that only tells the truth when you read its shape, not its height. That is the whole point of putting the charts side by side: not to rank the grids, but to see, hour by hour and rupee by rupee, exactly what each one would have to change, and who is best placed to change it.
Sources & method
All four charts are live India Energy Atlas state-page panels for Rajasthan and West Bengal, captured on 22 July 2026. Generation mix and carbon are drawn from SLDC telemetry where a live feed exists and modelled otherwise, labelled accordingly on each state page. “Emitted today” is cumulative tonnes of CO₂; see the carbon-intensity methodology for the production-versus-consumption conventions.