
One country, many prices: when India's market splits
India's day-ahead exchange cleared as one national price for almost every block-area observation in the month to 22 July. Every material split landed in a single evening, when northern areas paid up to ₹6,390/MWh more than the rest of the country.
India's day-ahead power exchange spent almost the whole of the month to 22 July 2026 printing a single national clearing price. On one evening it did not. For a few hours on 5 July the market broke in two, and at its widest the northern bidding areas paid nearly ₹6,400/MWh more than the rest of the country for the same power at the same instant (Fig. 1). Congestion in India is rare and violent, which makes the average of it close to useless as a risk number.
Almost all the time, India clears as one price #
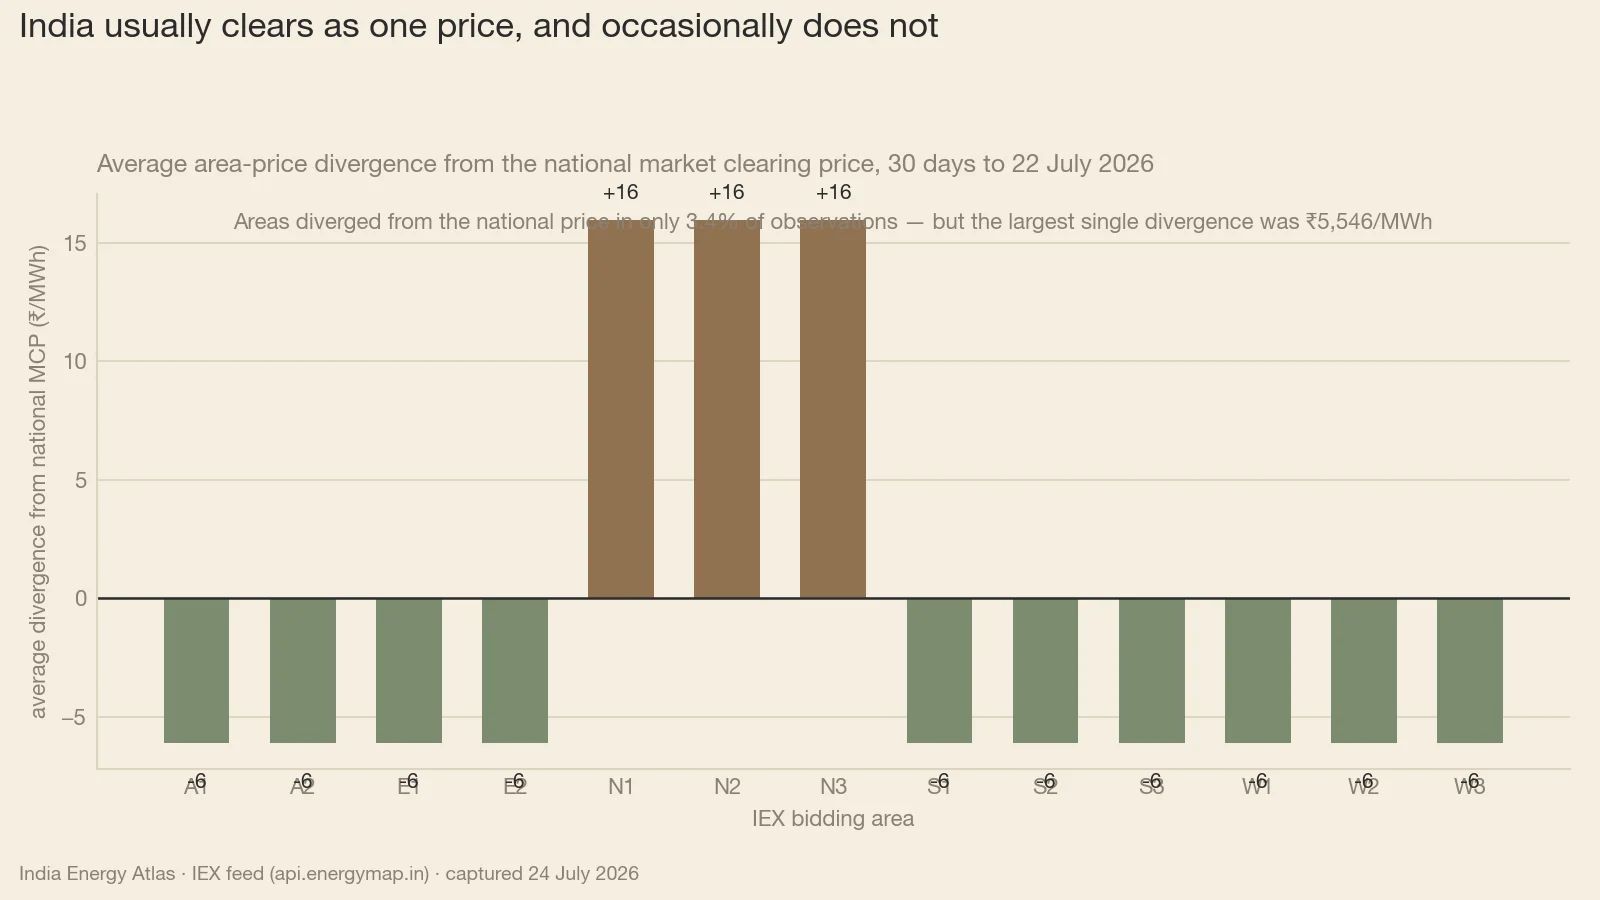
The India Energy Atlas area-price feed covers all thirteen IEX bidding areas across every fifteen-minute day-ahead block in the twenty-nine delivery days to 22 July. Roughly one observation in thirty differed from the national market clearing price at all. The other 96.6% cleared at exactly the national number (Fig. 1).
Hold that base rate. For most operational purposes India's day-ahead market behaves like a copper plate: a generator's realised price, a distribution company's purchase cost and the number on the exchange's front page agree almost all of the time.
Then hold the second fact, which is the sharper one. Every divergent observation in the window falls on a single delivery day, 5 July, and on nearly every block of it. Twenty-nine days of market data contain one day of disagreement.
How a market splits #
An exchange collects buy bids and sell offers from the whole country and solves for the single price that clears the most volume. That solution assumes the grid can move the resulting power to where it was bought.
When the transmission corridor between two parts of the country runs out of headroom — a line at its thermal limit, a security constraint binding, an outage on a parallel path — the solver can no longer treat the country as one pool. It splits the market into areas and clears each with only the flow the corridor can carry. The importing area gets less cheap power than its buyers wanted and clears higher; the exporting area holds generation it cannot ship and clears lower. The gap between them is the price of the missing wire, and it surfaces as a divergence between area prices and the national print.
That is the mechanism. Pinning a divergence on a named corridor takes more than price data. The Atlas dataset note treats a non-zero divergence as a necessary condition for binding congestion that falls short of proving it, and corridor attribution stays an inference, because block-by-block flows go unpublished.
The month's entire material divergence fits in one evening #
Half of those divergences are noise. The median one is seven paise a megawatt-hour: rounding between two separate exchange publications, carrying no economic signal whatever. Apply the dataset's own materiality convention — a spread above ₹300/MWh together with more than one distinct area price inside the same block — and the count collapses to eighteen blocks in the entire month, 0.65% of the total (Fig. 1).
All eighteen sit on 5 July. All eighteen sit in the evening ramp, or in the small hours that carry that evening past midnight.
The escalation reads cleanly, block by block. As the ramp builds, the northern areas pull away from the rest of the country: a few hundred rupees apart at half past eight in the evening, several thousand by ten. By eleven the northern areas are pinned at the ₹10,000/MWh administered ceiling while the other ten clear below ₹4,000, and the widest gap of the window lands in the final block of the day.
Same country, same fifteen minutes, prices almost three times apart.
Midday on that same date is the counterpoint. Through the solar belly all thirteen areas cleared together, at a couple of hundred rupees a megawatt-hour. A day that gave power away at lunchtime rationed it at ten rupees a unit before midnight, unevenly across the map.
Twenty-nine days of market data contain eighteen blocks of disagreement, and a whole month of congestion risk sits inside four and a half hours of one evening.
Why the monthly average understates the exposure #
Averaged across every block in the window, the northern areas ran a premium of about ₹16/MWh to the national price, and the A, E, S and W areas a discount of a few rupees. Mean realised prices for the two groups differ by roughly 0.4% (Fig. 1).
Those figures are arithmetically correct and operationally misleading. The premium is what survives once a month of exact convergence dilutes one evening of violent disagreement. The worst block of the window ran some four hundred times that monthly average. A risk model budgeting the average for basis exposure will be short by two orders of magnitude on the one night that matters.
The tail runs both ways. On the split day the ten non-northern areas cleared thousands of rupees below the national print, so a seller marking to the headline number was wrong by that much in the other direction.
Position size makes it concrete. A 100 MW position sitting in the northern areas across those eighteen blocks would have realised about ₹15 lakh more than the identical position elsewhere (modelled, gross of transmission charges and losses). Four and a half hours.
The split lands on an evening that is already tight #
Congestion stacks on a market that is scarce in the same hours. Across the delivery week around this capture, more than a third of day-ahead blocks cleared at the ₹10,000/MWh ceiling, and the mean price sat far above the median (Fig. 2) — the signature of a market that spends real time rationing by price. Over the area window the northern areas and the other ten sat at the ceiling almost equally often, because the cap binds nationally.
That adjacency is what makes a split dangerous. An importing area entering the evening already close to the cap has no headroom: the moment the corridor binds, its price has one place to go. The northern areas went there at eleven on 5 July, while the rest of the country cleared under ₹4,000.
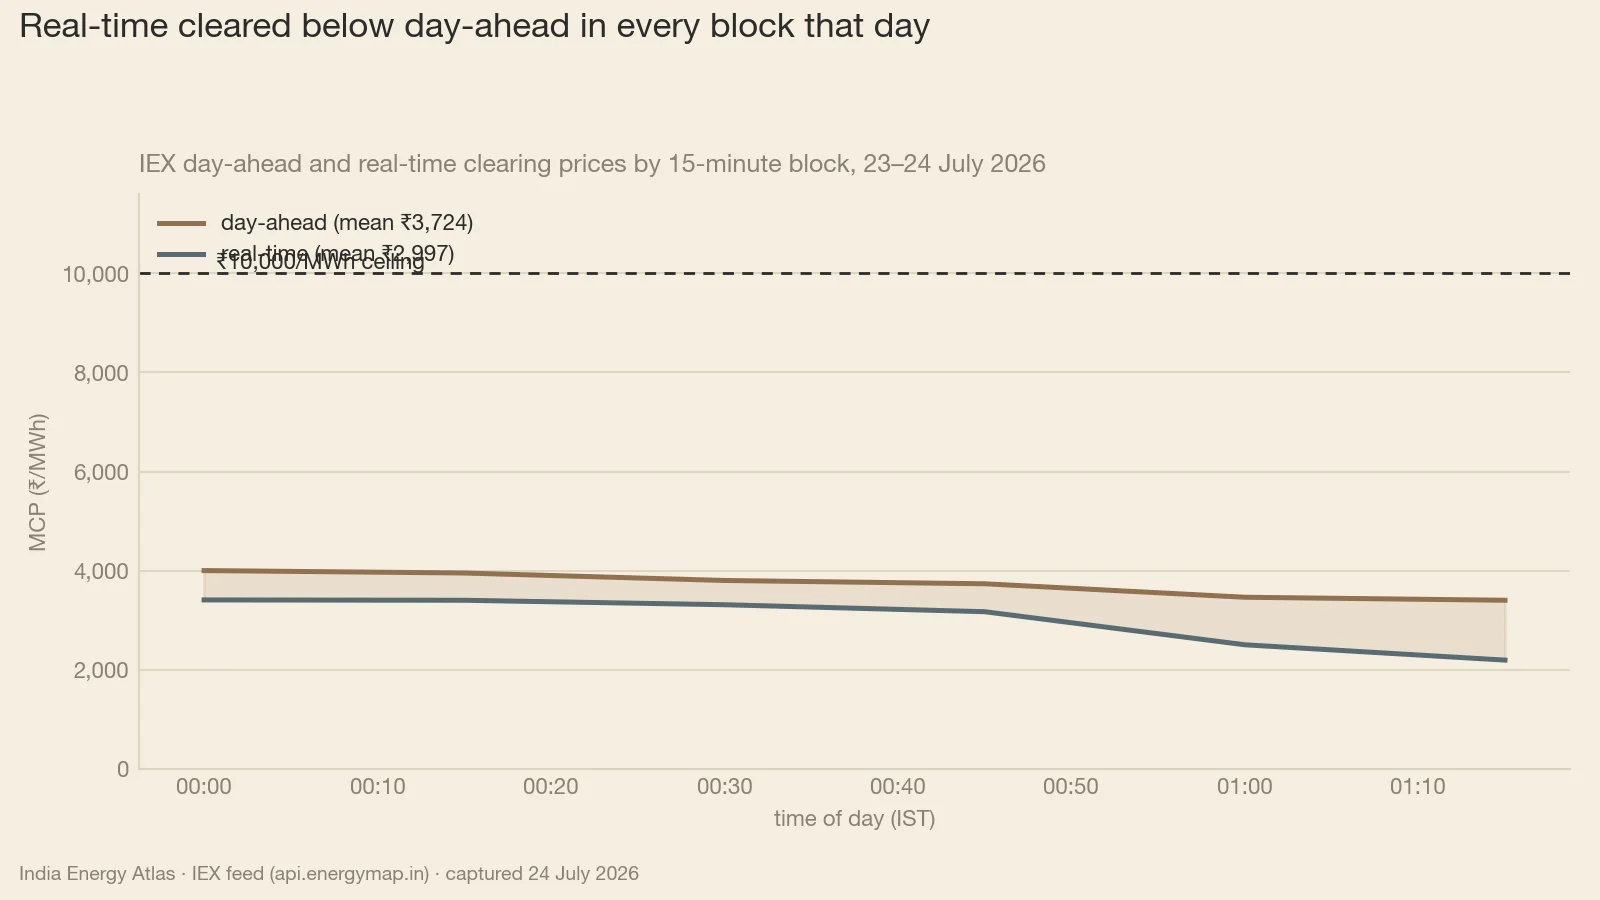
Timing flexibility helps with scarcity and does nothing for congestion. On the most recent delivery day in this capture, real-time cleared below day-ahead in every single block, by roughly ₹1,500/MWh on average (Fig. 2). A buyer who could wait was paid to wait. A buyer inside a constrained area has no equivalent lever, because the constraint binds on physical delivery at that location, and a later session does not move the wire. Both markets sit on /iex-market.
What the area codes do and do not say #
One caution governs everything above. The bidding areas are exchange clearing zones, and they do not map one-to-one onto states. N1 is not Punjab. W2 is not Maharashtra. They are the zones the exchange's coupling algorithm uses to clear, and a state's load, its generation and its supply position can each sit differently relative to a given boundary.
India's northern grid region includes Punjab, Haryana, Delhi, Rajasthan and Uttar Pradesh, and a northern-area premium is a signal about that region's import position in that block. It does not identify which utility paid it.
Two caveats travel with the numbers. Area prices and the national MCP are scraped from different exchange publications, so sub-rupee divergences carry no information. And reading the eighteen material blocks as transmission congestion remains an inference that fits the mechanism; observing the binding corridor would take flow data the market does not publish.
So what — who should act #
For the DISCOM and system planner. Your average basis to the national price is a rounding error in either direction, and neither direction belongs in a procurement plan. Size the tail: eighteen blocks in twenty-nine days, averaging a gap of roughly ₹3,400/MWh and peaking near ₹6,400 (Fig. 1). If your evening cover leans on imports across a single corridor, price exposure has the same shape as volume exposure, and it clusters in the late evening and the first hour after midnight. Check your own evening load shape on the state page against the hours the split occurred.
For the IPP and storage developer. Location is a revenue line, and across this window it was worth about ₹15 lakh per 100 MW (modelled). A battery or a peaker sited inside a chronically importing area captures the local price, and the local price is the one that went to the ceiling while the national print stayed near ₹4,500. A fraction of a percent of blocks is a thin base to underwrite, so treat area basis as upside layered on the national arbitrage. The split day's own midday belly offered a charging price of a couple of hundred rupees a megawatt-hour.
For the regulator. A market that splits in fewer than one block in a hundred is well coupled, and the concentration is the finding worth examining: every material split in twenty-nine days landed in a single four-and-a-half-hour evening window, on one date. That points at a corridor adequate for virtually every block of the month and binding in exactly the hours the country is shortest. Block-by-block corridor flow publication would convert today's price-based inference into an observation.
For the trader and analyst. Track the count of blocks per month carrying more than one distinct area price, and ignore divergences under ₹300/MWh entirely, because the median divergent observation in this window rounds to nothing. The material signal is binary and clustered: it appears in the evening ramp, when the national price is already elevated, and with almost no warning from the monthly average. Model basis as a jump process with a low arrival rate and a fat jump, and size collateral against the worst block in Fig. 1. Solar-heavy exporting states such as Rajasthan and Gujarat sit on the other side of the same constraint, where the exposure is realising thousands of rupees below the headline.
The headline number will keep saying that India has one power price. For a few hours a month, in the hours when it costs the most to be wrong, it has two.
Sources & method
Area prices are IEX day-ahead area market clearing prices in ₹/MWh from the India Energy Atlas iex_area_mcp_divergence dataset (atlas_intelligence.iex_area_prices, 13 bidding areas: A1, A2, E1, E2, N1, N2, N3, S1, S2, S3, W1, W2, W3), differenced against the national DAM MCP from atlas_intelligence.iex_market_data; captured 24 July 2026. The area window covers 2,781 fifteen-minute blocks from 24 June to 22 July 2026 IST (29 delivery days, 36,153 block-area observations); underlying timestamps are UTC and converted to IST at UTC+5:30. Day-ahead ceiling and DAM-versus-RTM figures come from the same Atlas IEX feed for the 20–24 July and 23–24 July 2026 delivery days respectively. ₹1,000/MWh = ₹1/kWh = ₹1 per unit; ₹10,000/MWh is the administered ceiling. Conventions and caveats: divergence is an arithmetic spread, not a model output; the materiality convention used here (|spread| > ₹300/MWh and more than one distinct area MCP in the block) is the dataset's own, and the median divergent observation is ₹0.07/MWh, which reflects rounding between two separate exchange publications rather than any economic signal. A non-zero divergence is a necessary condition for binding transmission congestion and does not prove it; block-by-block corridor flows are not published, so corridor attribution is an inference. IEX bidding areas are exchange clearing zones and do not map one-to-one onto Indian states; no area price in this article is attributed to a named state. The ₹15 lakh per 100 MW figure is modelled (25 MWh per block against the observed area gap) and is gross of transmission charges, losses and any bilateral cover.