

When the market hits the ceiling: India's ₹10 scarcity signal
For 37% of day-ahead blocks this week, India's power exchange cleared at its ₹10,000/MWh cap. A market pinned at its ceiling has stopped discovering the price of scarcity and started rationing it — and the evening is where it bites.
India's day-ahead power market exists to discover a price. On the evening of 23 July it discovered the same one for five hours running — the regulatory ceiling of ₹10 a unit, block after fifteen-minute block, from dinner time until almost midnight. A price that stops moving has stopped carrying information about scarcity and started rationing it.
A market pinned at its own ceiling #
Across five delivery days in late July, more than a third of every day-ahead block on the India Energy Atlas IEX feed cleared at exactly that cap — ₹10,000 per megawatt-hour, the highest number the regulator allows the exchange to print. Over the same window the mean clearing price finished close to half as much again as the median.
That gap between mean and median is the whole story. India's power market is inexpensive for most of the day and slams into its ceiling for a handful of hours in the evening. The average is an artefact of the collision, and quoting it in a board paper flatters a portfolio that is quietly exposed at dinner time.
Look inside a single capped block on the 24 July delivery day and the mechanics are plain. Buyers submitted 11,843 MW of purchase bids. Sellers offered 5,298 MW. The exchange cleared what supply existed, the price went to the cap and stayed there, and roughly 6,600 MW of willingness-to-buy found nothing to buy.
Nothing about that block is exotic. It is the ordinary arithmetic of an auction whose price has been forbidden to finish its job. When a market clears at its ceiling, the price becomes an administered number and the quantity becomes the variable that adjusts. That adjustment then happens somewhere outside the exchange — in a load-despatch instruction, a costlier bilateral contract, or a distribution company deciding which feeder waits.
The shape of the day explains the shape of the price #
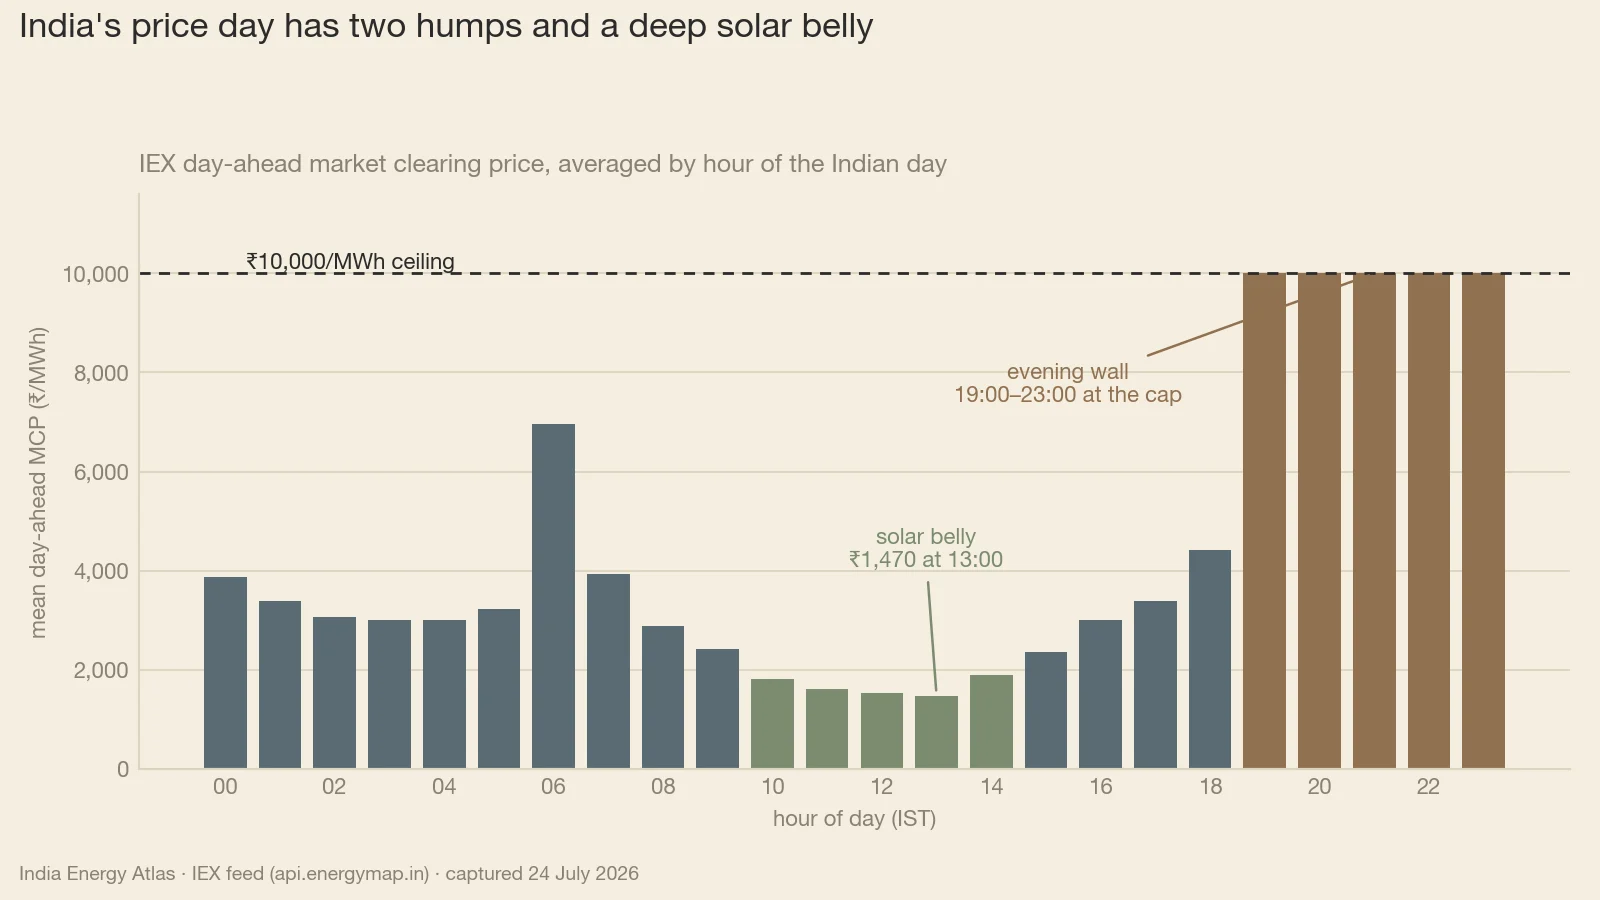
Average the day-ahead clearing price by hour of the Indian day and the curve is unmistakable. Early afternoon is the cheapest power India sells, at around ₹1,500 a megawatt-hour. By seven in the evening the same market sits at its ceiling, and it stays there until eleven. The swing from the day's cheapest hour to its dearest is close to sevenfold, and the whole journey takes six hours (Fig. 1).
There is a smaller hump before that, at first light, when the country wakes and the sun is not yet high enough to matter. India's load curve now has two humps and a deep midday trough — the camel shape that utility-scale and rooftop solar have carved into net load over the past few years.
The trough is solar doing its job. For three or four hours in the middle of the day, a large volume of low-cost generation bids into a market that does not need all of it, and the price falls to something close to fuel-free. The evening wall is the same solar leaving. Demand in Indian cities peaks after sunset, when air-conditioning, lighting and commercial load overlap and photovoltaic output is zero.
India's exchange is short of one specific thing: energy that can be delivered between seven and eleven at night.
That distinction now governs almost every investment decision in the Indian power sector. A megawatt that generates at noon competes against the cheapest print on the board. The same megawatt delivered at nine in the evening competes against the ceiling. Two assets with identical nameplate ratings and identical annual output can therefore earn wildly different revenue, and the difference comes down to the hours in which they deliver.
Fifteen per cent of the year, every year #
A single hot July week proves little on its own. The trailing year says the same thing more soberly.
Across every fifteen-minute day-ahead block of the past year, the price sat at or above the ₹10 ceiling for roughly one block in seven. It cleared above ₹5 a unit for a little over a fifth of the year, and above ₹3 a unit for more than half of it. The price-duration curve has a long, cheap body and a short, vertical head (Fig. 2).
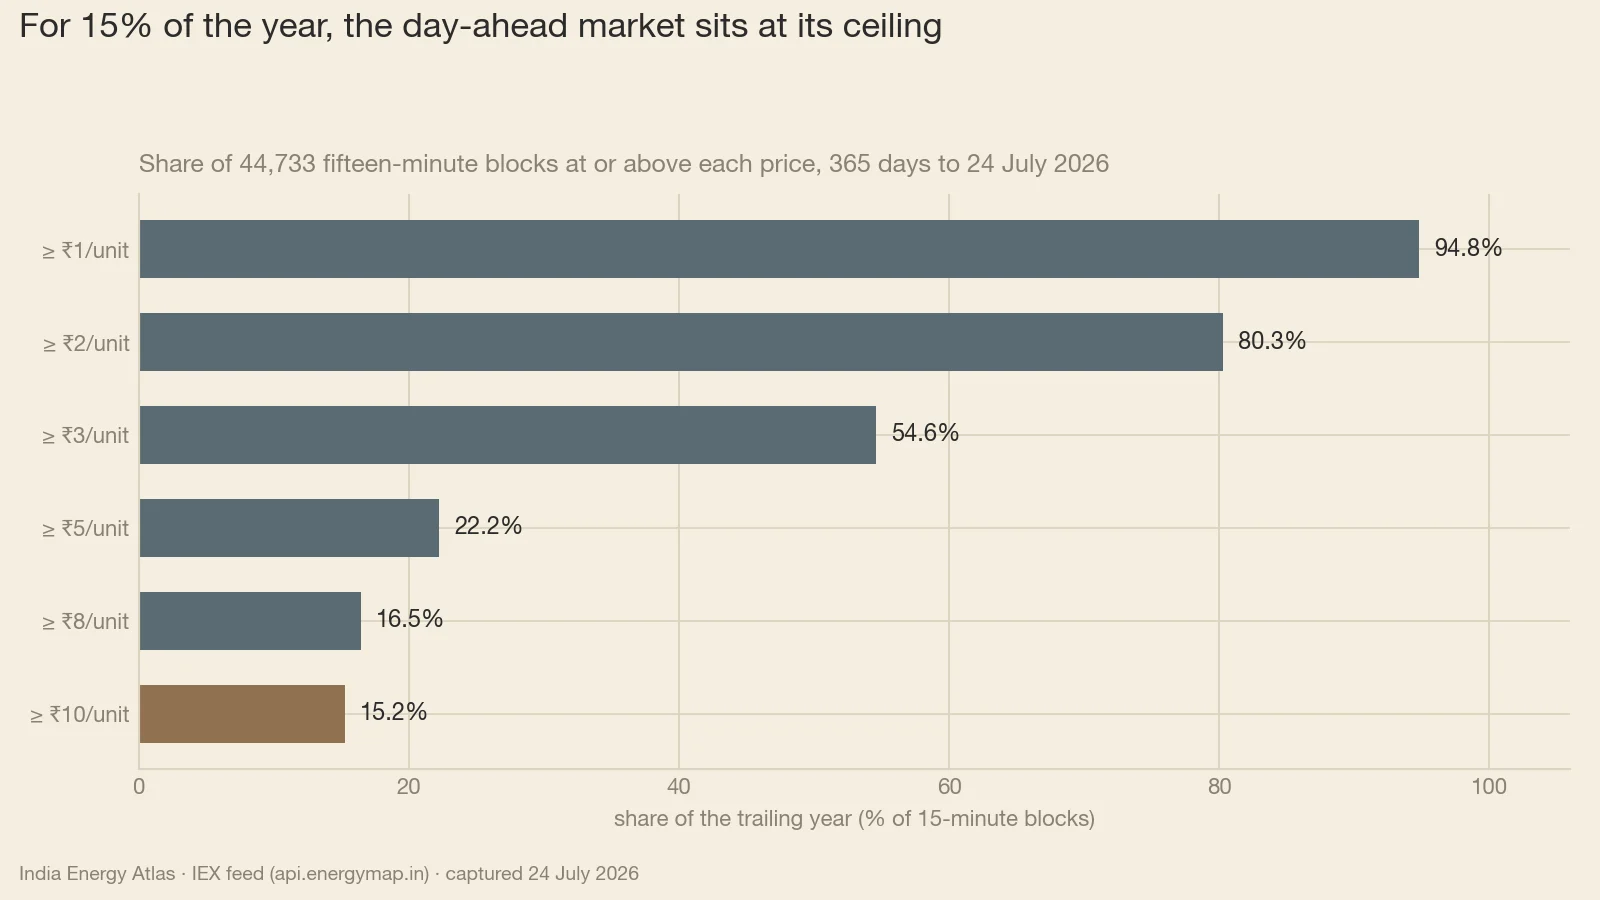
So the ceiling binds across the whole year, well beyond heatwave weeks. For roughly one hour in seven, India's day-ahead market rations by price. The rest of the time it works exactly as intended, and cheaply: the annual mean sits near ₹4,100 a megawatt-hour, with the median lower still.
The real-time market tells a gentler version of the same story. It touches the cap in about one block in five, and on the 23–24 July delivery day it cleared cheaper than day-ahead in every one of that day's ninety-six blocks. The average gap ran to about ₹1,500 a megawatt-hour. Buyers who could wait were rewarded that day. Buyers who could not wait paid the ceiling.
What the ceiling hides #
A capped price truncates the information a market is supposed to produce. Three things go missing.
The true cost of the marginal evening megawatt. When buyers chase more than twice the volume on offer, an uncapped price would keep climbing until demand voluntarily stepped back. Wherever it landed, that number would be the honest signal telling investors what evening capacity is worth. The cap replaces it with an administered figure and a queue, and a queue carries no information about value.
The value of flexibility. A battery, a demand-response contract or a flexible gas plant is worth the spread it can capture. Our storage-arbitrage read on the same late-July delivery day put the achievable charge-to-discharge spread for a four-hour asset above ₹8,000 a megawatt-hour. That is a large number, and it is still a floor on the true value, because the ceiling truncates the top of it.
Who actually went short. The exchange reports a national clearing price. It does not report which distribution company in Maharashtra or Uttar Pradesh covered its evening gap and which one leaned on load regulation. That reconciliation lives in state-level demand and despatch data, one layer below the market print.
All three omissions grow more expensive every year, because the peak keeps climbing. India's all-time peak demand keeps setting records; it now stands near 271 GW. The mark it replaced had held for barely a month. Renewables including hydro met about a third of that record hour, which is to say two-thirds of the hardest hour of the Indian year still came from thermal and hydro plant that has to be there, ramping, once the sun has gone.
So what — who should act #
For the DISCOM planner. Price your evening block explicitly. A portfolio that looks affordable against the annual average can be ruinous if the unhedged position concentrates in the four hours after seven, where the market prints its ceiling night after night. Audit the last twelve months of evening exposure against the hourly shape on /iex-market before the next tender, and check when your own peak actually lands on your state page.
For the IPP and storage developer. The arbitrage case lives in the shape of the day. An asset that charges in the midday trough and discharges into the evening wall monetises a spread of roughly ₹8,400 a megawatt-hour on a good day — and good days are uncommon, because the ceiling clears about a seventh of the year. Build the case on the full price-duration curve (Fig. 2); a single July evening will overstate it. Solar-heavy states such as Rajasthan offer the deepest midday troughs to charge into.
For the regulator. A market that spends a seventh of its hours at the administered cap is telling you the cap now binds as a routine feature of the year, well outside the emergency conditions it was designed for. The policy question is whether the ceiling still protects consumers or mostly suppresses the investment signal for the evening capacity India is short of. Either answer is defensible; leaving it unexamined is not.
For the trader and analyst. Track the count of capped blocks per day as a scarcity indicator in its own right. It moves before the monthly average does, and it is the cleanest early read on how tight the coming evening will be. Our forward-looking price work sits at /iex-market-forecasts.
The ceiling is doing what a ceiling does: holding a number down. The scarcity underneath it is still there, still growing, and still waiting for something that can deliver power at nine o'clock at night.
Sources & method
Prices are IEX market clearing prices (MCP) in ₹/MWh read from the India Energy Atlas market feed (api.energymap.in, /api/intelligence/iex-market-data and its duck-curve, price-duration and storage-arbitrage views), captured 24 July 2026. Day-ahead statistics cover 400 fifteen-minute blocks across the 20–24 July 2026 delivery days; the annual figures cover 44,733 fifteen-minute blocks over the trailing 365 days. ₹1,000/MWh = ₹1/kWh = ₹1 per unit; the ₹10,000/MWh ceiling is the administered cap. Timestamps in the underlying feed are UTC and are converted to IST (UTC+5:30) for the hourly profile. Percentages of time are reported as a share of observed blocks; absolute hour counts are deliberately not given because the block set spans multiple price areas. Figures are rounded in the running text and exact here and in the exhibit captions: the week's day-ahead mean was ₹5,610/MWh against a ₹3,834 median, with 37.2% of blocks at the ceiling; real-time averaged ₹4,350/MWh with 19.0% of blocks at the cap; on the 23–24 July delivery day, day-ahead averaged ₹4,465/MWh against ₹2,997 in real time and was dearer in all 96 blocks; the trailing-year day-ahead mean was ₹4,101/MWh and median ₹3,169, with 15.2% of blocks at or above ₹10/unit, 22.2% at or above ₹5/unit and 54.6% at or above ₹3/unit; the four-hour storage spread was ₹8,405/MWh (charge ₹1,595, discharge ₹10,000). The 24 July delivery-day block cited in the text is 23:45 IST: 11,843 MW bid, 5,298 MW offered, 5,191 MW cleared. National peak demand figures are from the Atlas national feed and, where cited, from PIB and Down To Earth. Storage-arbitrage revenue is a single-day gross energy margin before efficiency losses, degradation, charges and capital cost, and is not an annualised return.