

India past 250 GW: reading the new peak
India's peak demand went past 270 GW in May, and the larger part of the two-year gain arrived inside a single month. The harder statistic is a daily one: the six-hour walk from the cheapest afternoon hour to an evening pinned at the ceiling.
India's power system went past 270 GW of instantaneous demand this May, and met it, as it has met every maximum it has ever set. What is new is the shape of the day around that hour. The difficult stretch sits in the six hours after the middle of the day, when solar walks out of the stack and the demand centres switch on together. A peak is an annual statistic. The ramp underneath it is a daily one, and the market prices the difference between them with some force.
Two records inside 26 days #
The record book turned over twice in a single spring. India first went past the two-year-old mark of 250 GW in late April (PIB). Twenty-six days later it went higher again (Down To Earth). Fig. 1 plots the milestones in order; the striking feature is how tightly the last two crowd together. The larger part of the entire two-year gain arrived inside those four weeks.
Nameplate supply grew faster still over the same stretch. Roughly 65 GW of generating capacity was added last financial year alone, some three times the whole two-year increase in the peak. Side by side, the two look like a comfortable and widening margin. They are measuring different things.
A megawatt of capacity is a claim on a nameplate. A megawatt at the peak is a claim on availability in one specific quarter-hour, on one evening, at one point on the network. Renewables including hydro supplied about a third of the record peak. The remainder came from plant that had to be synchronised, loaded and ramping at that moment, and positioned where the load was.
Two peak numbers, measured two ways #
The Atlas national feed and the official record do not agree on how high India's peak has gone, and they should not be expected to. Our tracked peak sits about a gigawatt under the reported high, a gap of roughly half a per cent (Fig. 1). They are two instruments reading the same system.
The Atlas figure is the highest value the live feed has recorded, aggregated in near-real time from every state and union territory with a live connection — some 97% of national demand — and sampled on a fixed slot cadence. Nothing in that method is designed to catch an instantaneous maximum: a peak that lives inside a single quarter-hour can fall between two samples, and the demand outside the feed's coverage is never counted at all. The reported high is a different artefact, compiled after the fact from the complete despatch record of one day.
A feed that samples on a schedule and covers most of the country will therefore land near, and usually a little under, a figure assembled retrospectively from the whole. Read the two as independent confirmations that India's peak now sits in the high 260s. They should never be averaged into a single number, and the Atlas value should never be quoted as a record.
The distance between that peak and an ordinary hour is wide. At capture in late July the live national read was running at about four-fifths of the tracked peak, some fifty gigawatts short of it. An ordinary July hour therefore sits a long way below the number that makes headlines, which is why the record alone is a poor guide to how the system is run. The grid spends almost all its life somewhere else on that curve.
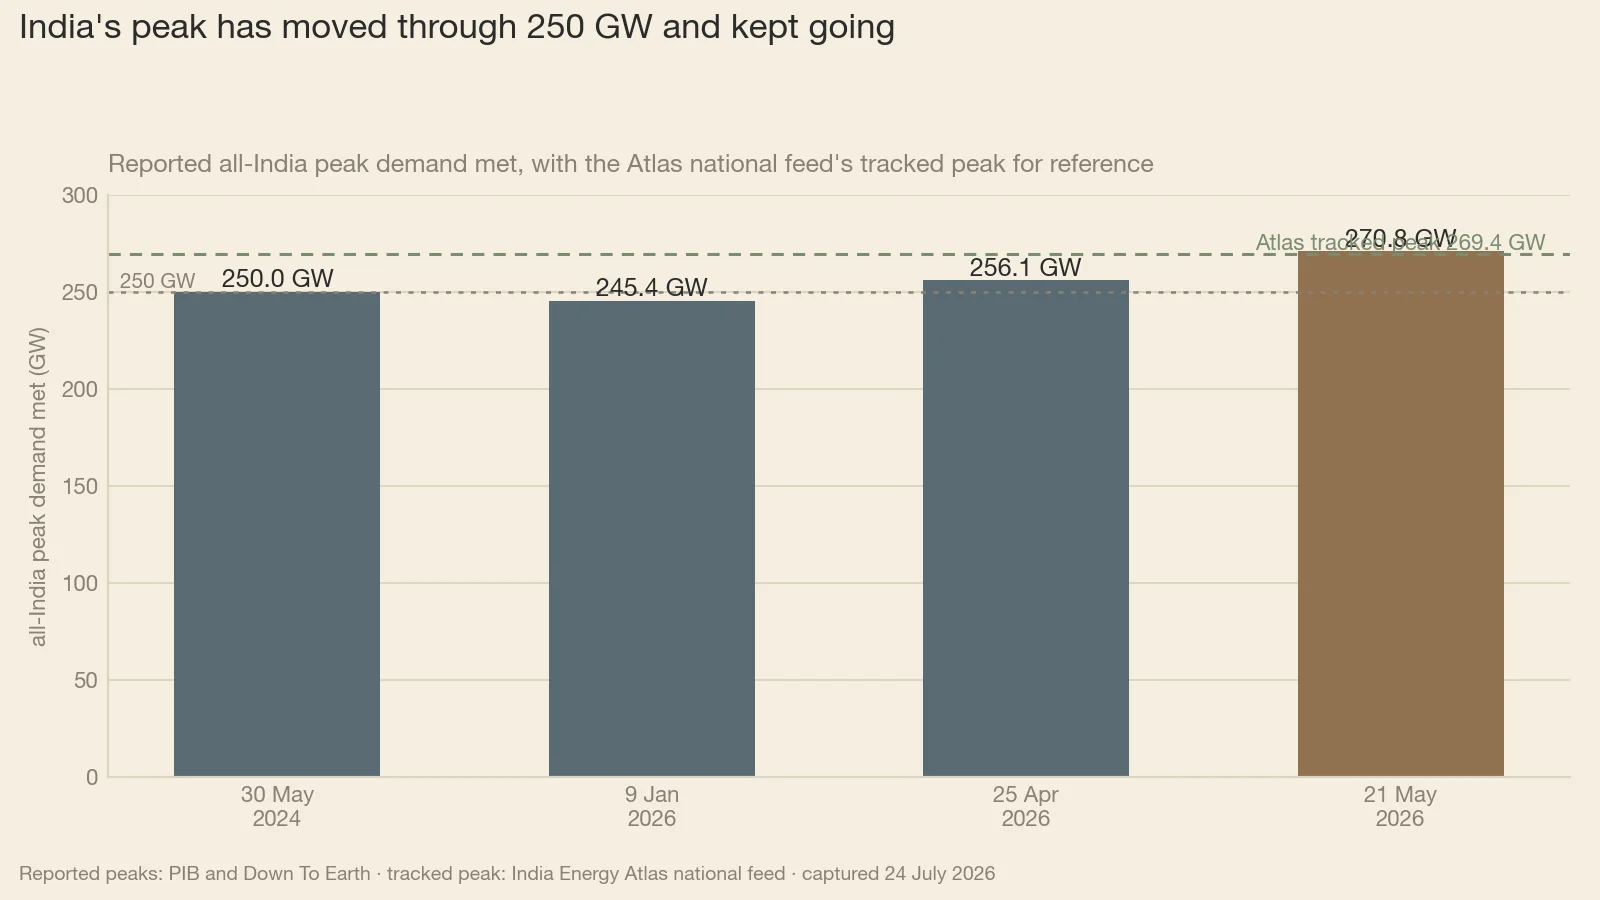
What a 270 GW hour asks of the grid #
Every operating margin scales with the peak. A one per cent reserve against today's record is about 2.7 GW of headroom (modelled) that has to exist, stay synchronised, and respond within seconds of being called. Each time the maximum climbs, the absolute size of a routine contingency climbs with it, and so does the volume of primary and secondary response the system holds back from the market. Reserve that is held is reserve that is not sold, so a higher peak quietly raises the cost of every hour, including the cheap ones.
The record hour is also a transport problem. The Atlas network layer maps close to 20,000 substations and some 377,000 route-km of transmission line. Serving the peak means moving power out of solar-heavy states such as Rajasthan and Gujarat through the middle of the day, then into demand centres such as Maharashtra and Tamil Nadu after dark. Those corridors were planned for smaller, steadier flows than the ones they now carry, and the direction of travel turns with the sun.
One honesty note on the renewable share. It is the figure reported for the record peak. Our feed does not carry the hour-by-hour generation composition of that day, so nothing above should be read as an Atlas measurement of what was actually generating at that instant.
Where the market says the system is tightest #
The price curve localises the stress far more precisely than an annual maximum can. Fig. 2 shows the day the exchange sees: day-ahead clearing prices averaged by hour across a week of July deliveries. There is a sharp bump early in the morning, before the sun is high enough to matter. There is a long belly through the middle of the day, when solar is doing the work and power clears at about ₹1,500 a MWh. And then the climb into an evening that sits flat against the ₹10,000/MWh ceiling for five straight hours.
From the bottom of the belly to the top of the wall is close to a sevenfold move inside a single calendar day (Fig. 2). Across that week's day-ahead blocks, more than a third cleared at the ceiling. The mean price sat well above the median, which is the evening doing all the work: a few capped hours drag the average away from the typical one.
India's hardest hour prices at ₹10 a unit, and it arrives six hours after the cheapest one.
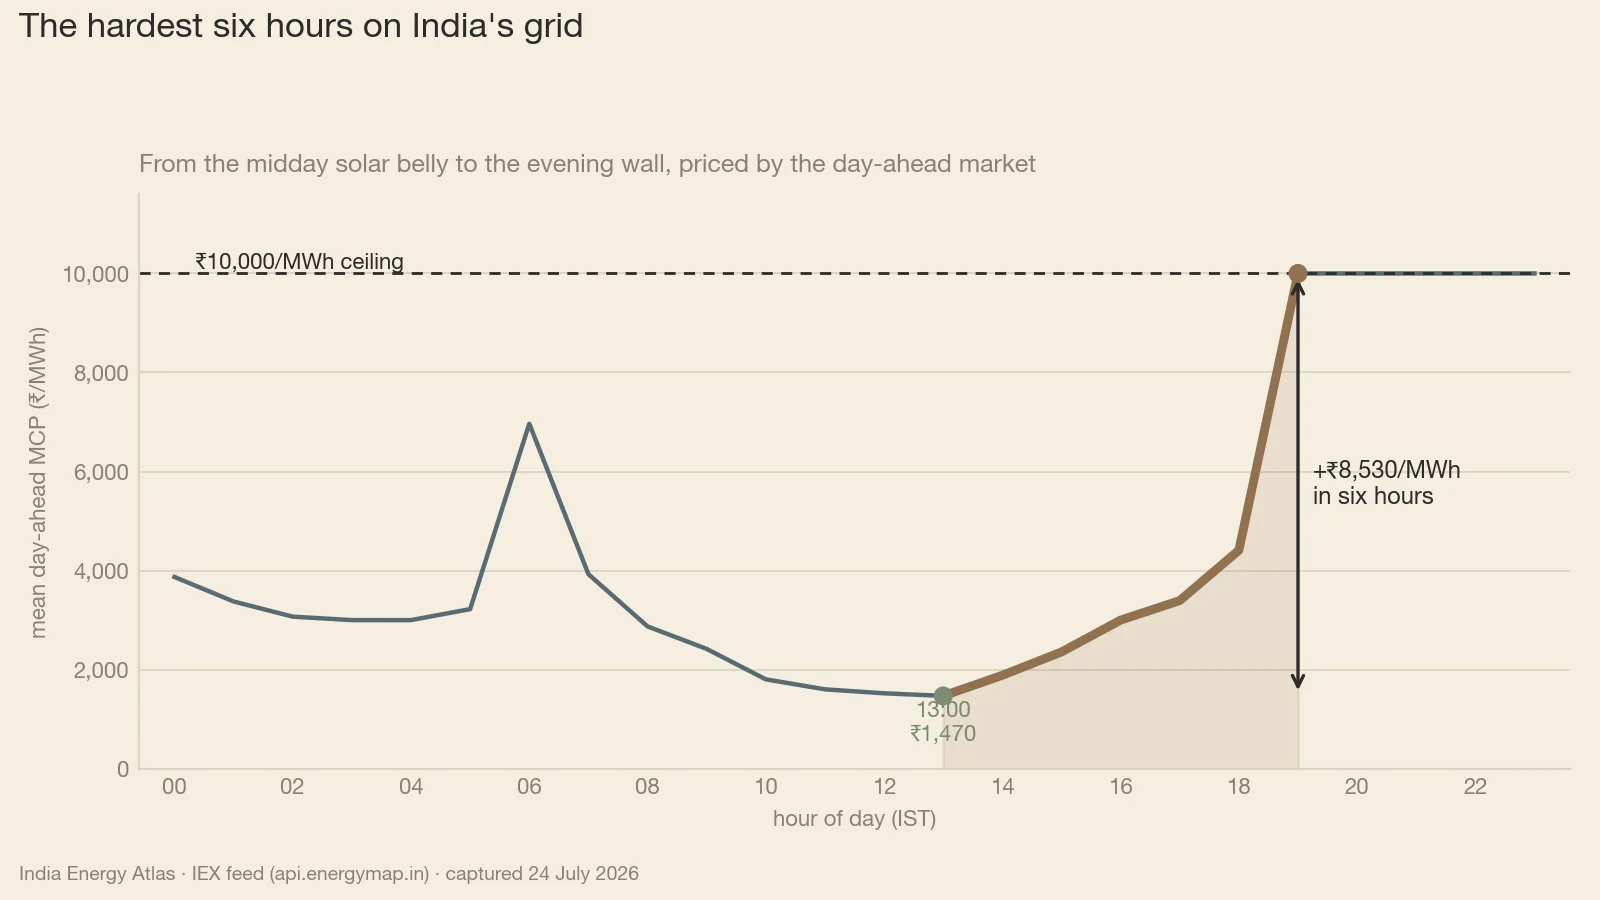
The six hours between the belly and the wall #
Between the midday trough and the evening wall two movements coincide. Solar output falls away to nothing while residential, commercial and cooling load in the demand centres climbs toward its daily maximum. The system has to replace the departing solar and serve the additional evening load with the same fleet, in the same six hours, every single day of the year. Neither movement is a surprise. The ramp is a scheduled daily event, and it still costs what it costs.
That is the operational content of a 270 GW peak. The megawatt total gets met; India has met every record it has set. It gets met by holding thermal plant part-loaded through the cheap midday hours so it can ramp after dark, which is expensive. It gets met by leaning on inter-regional transfers. And at the margin it gets met by paying the ceiling price on the exchange. Coal-heavy states such as Chhattisgarh and West Bengal supply much of that evening ramp today, and they pay for the privilege by running at part load through the belly, earning belly prices for the hours that make the evening possible.
Last year's capacity additions do a great deal for the belly, deepening a trough solar had already carved. What that capacity contributes to the wall depends entirely on how much of it can be dispatched at eight in the evening. That is now the first question worth asking of any Indian capacity-addition number, and it is rarely the one that gets asked.
So what — who should act #
For the DISCOM and system planner. Procure against the evening window as a product in its own right. A portfolio balanced to an annual maximum in the high 260s can still be short in the four hours the exchange prices at the ceiling, because peak-hour adequacy and evening-hour adequacy are separate tests with separate answers. Run both, and size the second against an hourly shape. The Atlas demand forecast at /forecast and the per-state pages carry that shape for each of the 36 states and union territories in the live feed, which is the profile a tender should be built against.
For the IPP and storage developer. The investable quantity here is the belly-to-wall spread, roughly ₹8,500/MWh, and the handful of hours it sits in (Fig. 2). An asset that charges through the midday trough and discharges into the evening wall is selling into the only hours the system is genuinely short, which is why storage economics look far better on a daily spread than an annual average. Then discount it honestly. This July week put more than a third of blocks at the cap, while across the trailing year the ceiling has cleared roughly one hour in seven. Build the case on the full hourly shape at /duck-curve, across the whole year.
For the regulator. Two facts now sit next to each other. The peak has grown by about 20 GW in two years, and the evening cleared at the administered cap in more than a third of this week's day-ahead blocks. Together they describe a system adding demand faster than it is adding dispatchable evening supply, with the price signal for that supply capped. There is also a measurement question worth settling. A national peak confirmed only after the fact is a weak control signal, and near-real-time coverage of almost the whole country already exists. Publishing it as a standing official series would let everyone argue from the same number.
For the trader and analyst. Track the afternoon-to-evening move as a series in its own right, alongside the count of capped blocks per day. The annual peak prints once. The belly-to-wall ramp prints every day of the year, and it turns well before any monthly average does. When the all-time high can move by close to 15 GW inside four weeks, as it did this spring, a monthly mean is reporting history.
Extend the past two years' growth at the same rate (modelled) and the next all-time high lands somewhere north of 280 GW. India will meet that one too. The number worth watching is what stands ready to deliver at eight o'clock on the evening it happens.
Sources & method
First-party figures are read from the India Energy Atlas national demand and IEX market feeds (api.energymap.in), captured 24 July 2026 (IST). The tracked national peak of 269.4 GW, the live reads of 213.4 GW (00:15 IST slot) and 221.2 GW, the 36 states/UTs and 97.3% national coverage, and the mapped grid footprint of 19,830 substations, 39,400 transmission lines and 377,130 route-km all come from that feed. Day-ahead price statistics cover 400 fifteen-minute blocks across the 20–24 July 2026 delivery days; hourly averages convert the feed's UTC timestamps to IST (UTC+5:30); prices are IEX market clearing prices in ₹/MWh, where ₹1,000/MWh = ₹1 per unit and ₹10,000/MWh is the administered ceiling. The trailing-year figure of 15.2% of blocks at the ceiling covers 44,733 blocks over 365 days and is reported as a share of observed blocks, since the block set spans multiple price areas. The all-time high of 270.8 GW (21 May 2026), the prior records of 256.1 GW (25 April 2026) and 250 GW (30 May 2024), the 34% renewable-including-hydro share of the record peak and the ~65 GW of capacity added in FY2025-26 are the officially reported figures, per PIB and Down To Earth as linked in the text. Caveats: the Atlas tracked peak and the reported all-time high are different measurements of the same system and are not averaged or substituted for one another; the Atlas feed does not carry the hour-by-hour generation composition of 21 May 2026, so the 34% share is carried here as a reported figure only; the reserve arithmetic (1% of 270.8 GW = 2.71 GW) and the forward growth estimate of roughly 11 GW to the next record are simple modelled extensions of the stated figures and are labelled as such; and installed-capacity totals from the Atlas plant layer are deliberately left uncited, since that layer covers a mapped subset of the national fleet.