
India now has two power prices, and only one of them is falling
Held to the same four months of each year, India's midday day-ahead price fell every year since 2022 while the evening price did not move. The mechanism is solar, and it breaks price extrapolation.
What four years of clearing prices show #
I have been reading India's day-ahead clearing prices with one restriction in place. Every comparison below uses the same four months of the calendar, April through July, in each year from 2022 to 2025. That restriction matters because Indian electricity demand is strongly seasonal, and a naive year-on-year comparison would mostly measure the weather. With the window held fixed, whatever remains is structural.
What remains is that the price of electricity in the middle of the day fell in every year of the sample. The price of electricity in the evening did not.
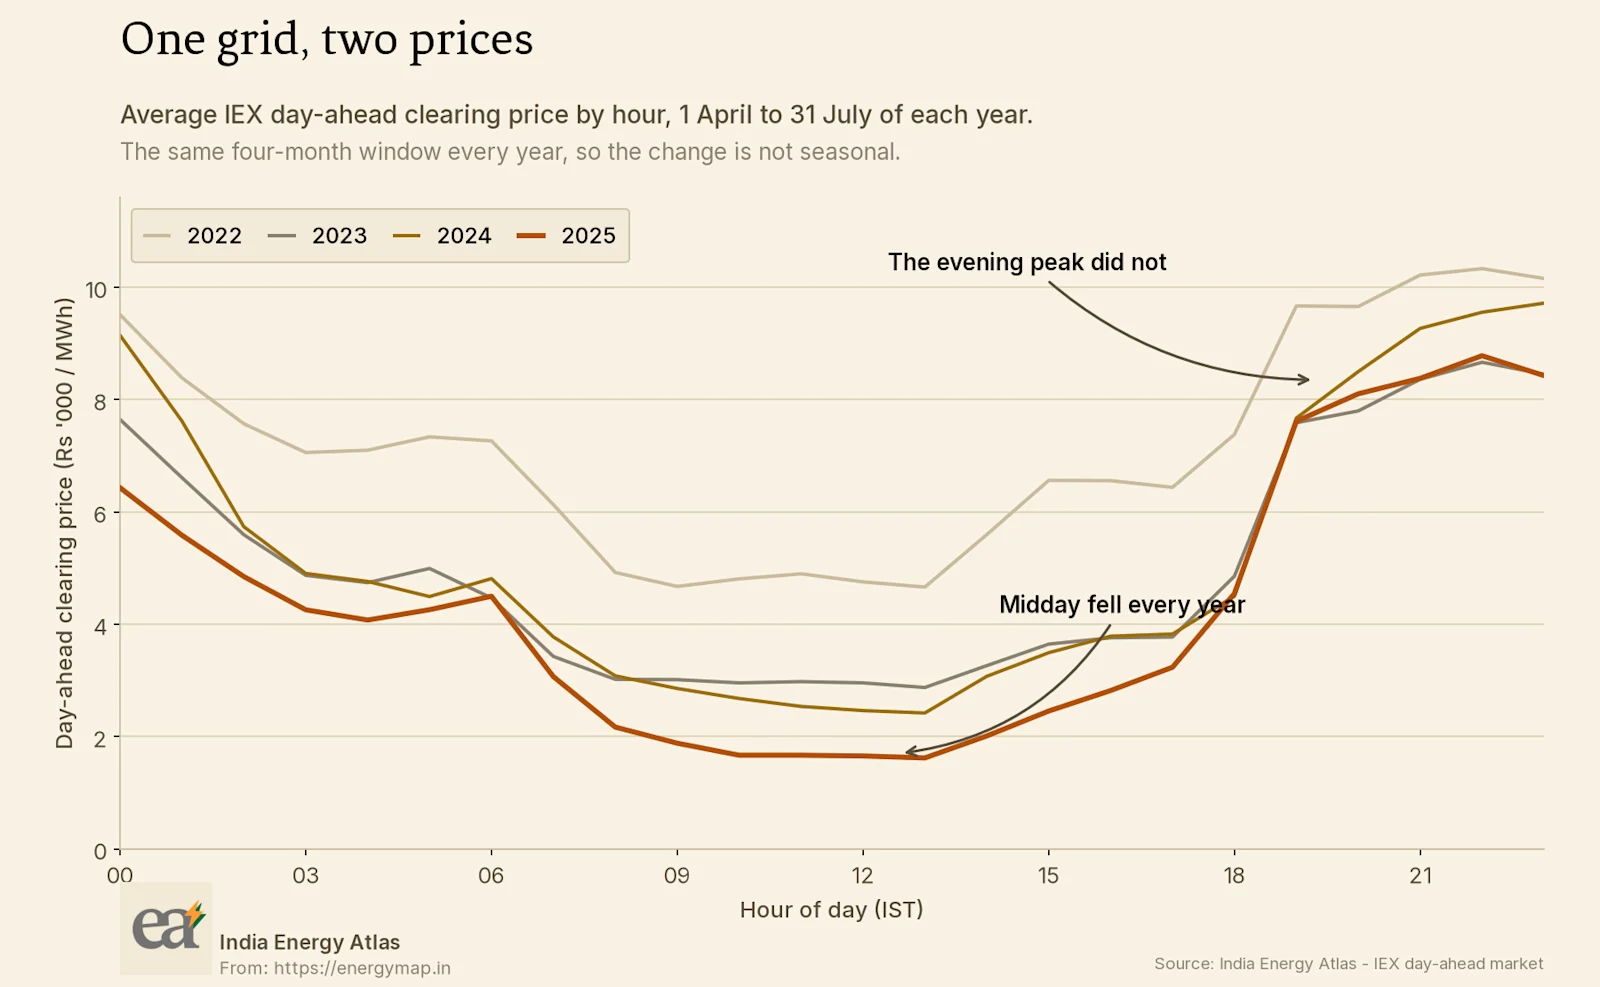
I want to be careful about the scope of the claim. This describes a change in the shape of the day. Indian power has not become cheap overall, and the exchange is a small share of national supply, so these are marginal prices rather than the average cost of anyone's electricity. What they describe accurately is the price a buyer faces at the moment they choose to draw an extra unit, which is the price that governs a procurement or dispatch decision.
How I checked it #
Three things could produce this pattern without any structural change, and I tested each before concluding anything.
The first is seasonality, which the fixed April to July window removes. The second is the regulatory price ceiling, which fell during the period and would mechanically compress the top of the distribution. That change would depress the evening average and work against the result I am reporting, so it cannot be generating it. The third is a change in traded volume, where a thinner midday market could clear at unrepresentative prices. Volumes at midday rose over the period rather than falling, so that explanation does not hold either.
What survives those checks is a real change in the marginal cost of supply by hour.
The gap, and how fast it opened #
The cleanest way to state the result is as a ratio. Take the average evening price and divide it by the average midday price in the same window. In 2022 the two were close enough that a buyer could sensibly treat the day as one price with some noise around it. By 2025 they were not close.
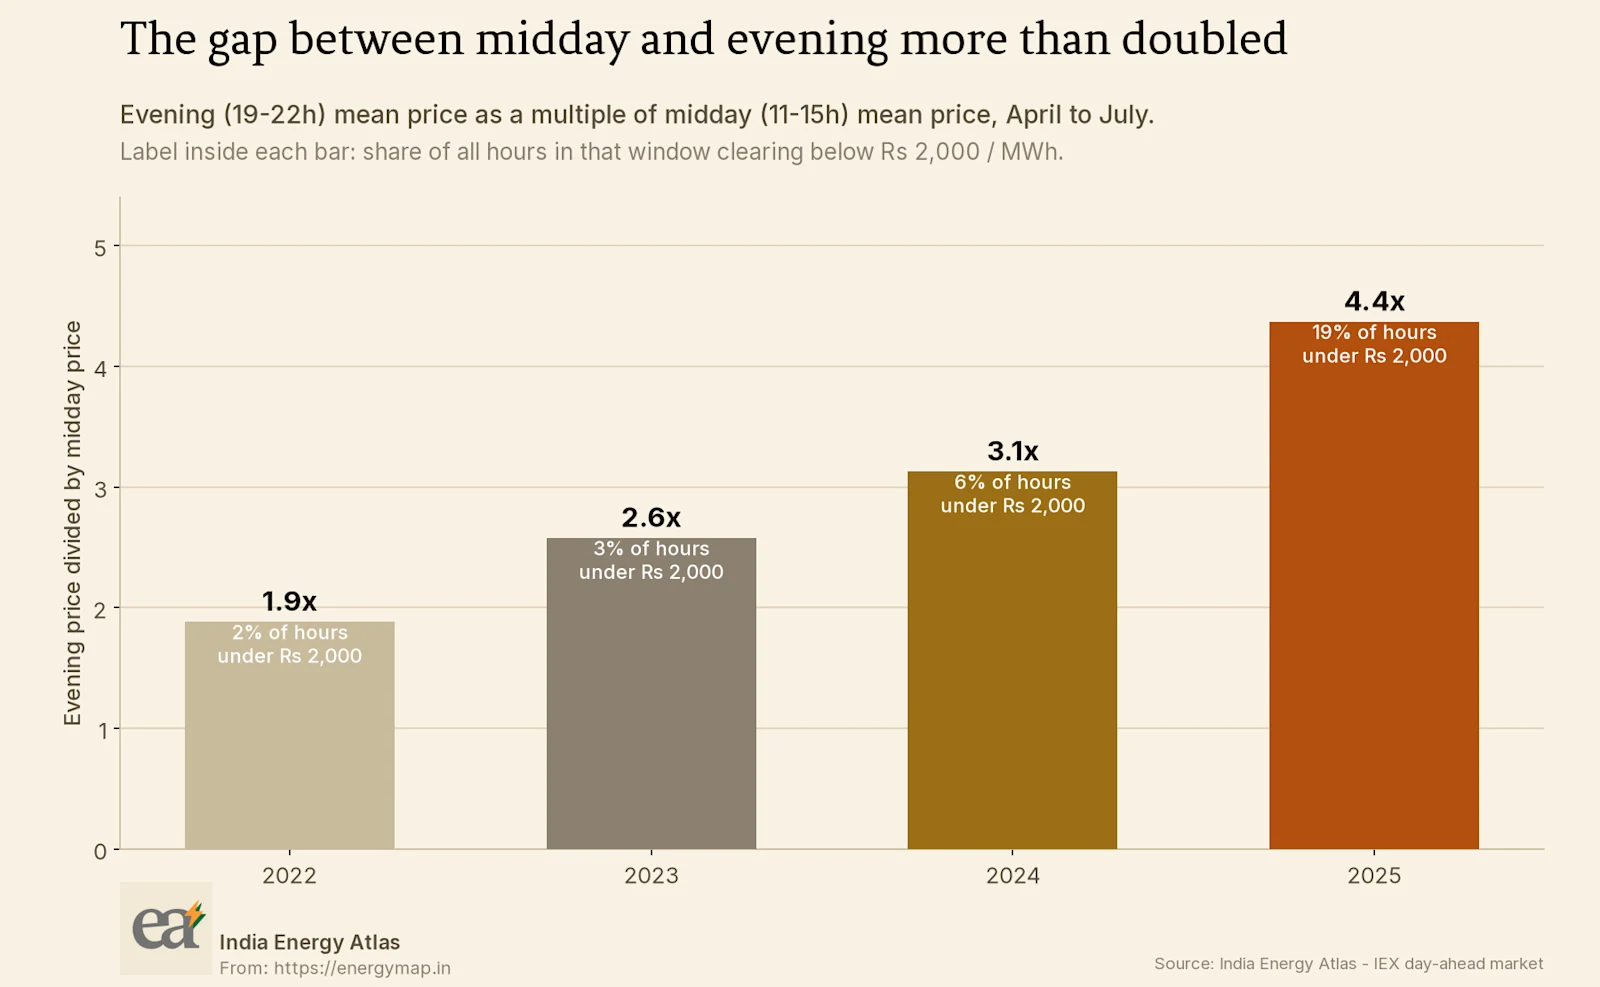
The second number in that exhibit is the one I find more useful for planning. It counts how often the market cleared below a threshold that is roughly the running cost of an efficient coal unit. In 2022 this happened in a handful of hours across the whole window. By 2025 it happened in close to a fifth of them. A thermal generator that once expected to run economically through the daylight hours now faces a meaningful block of the year where it does not.
A model calibrated on the 2022 shape of the Indian day will get the average roughly right and the decision entirely wrong.
The mechanism #
I do not think this needs a complicated explanation. The measured national feed shows solar's share of generation rising from nothing before dawn to roughly a third of everything the country produces at midday, then returning to nothing before the evening peak begins.
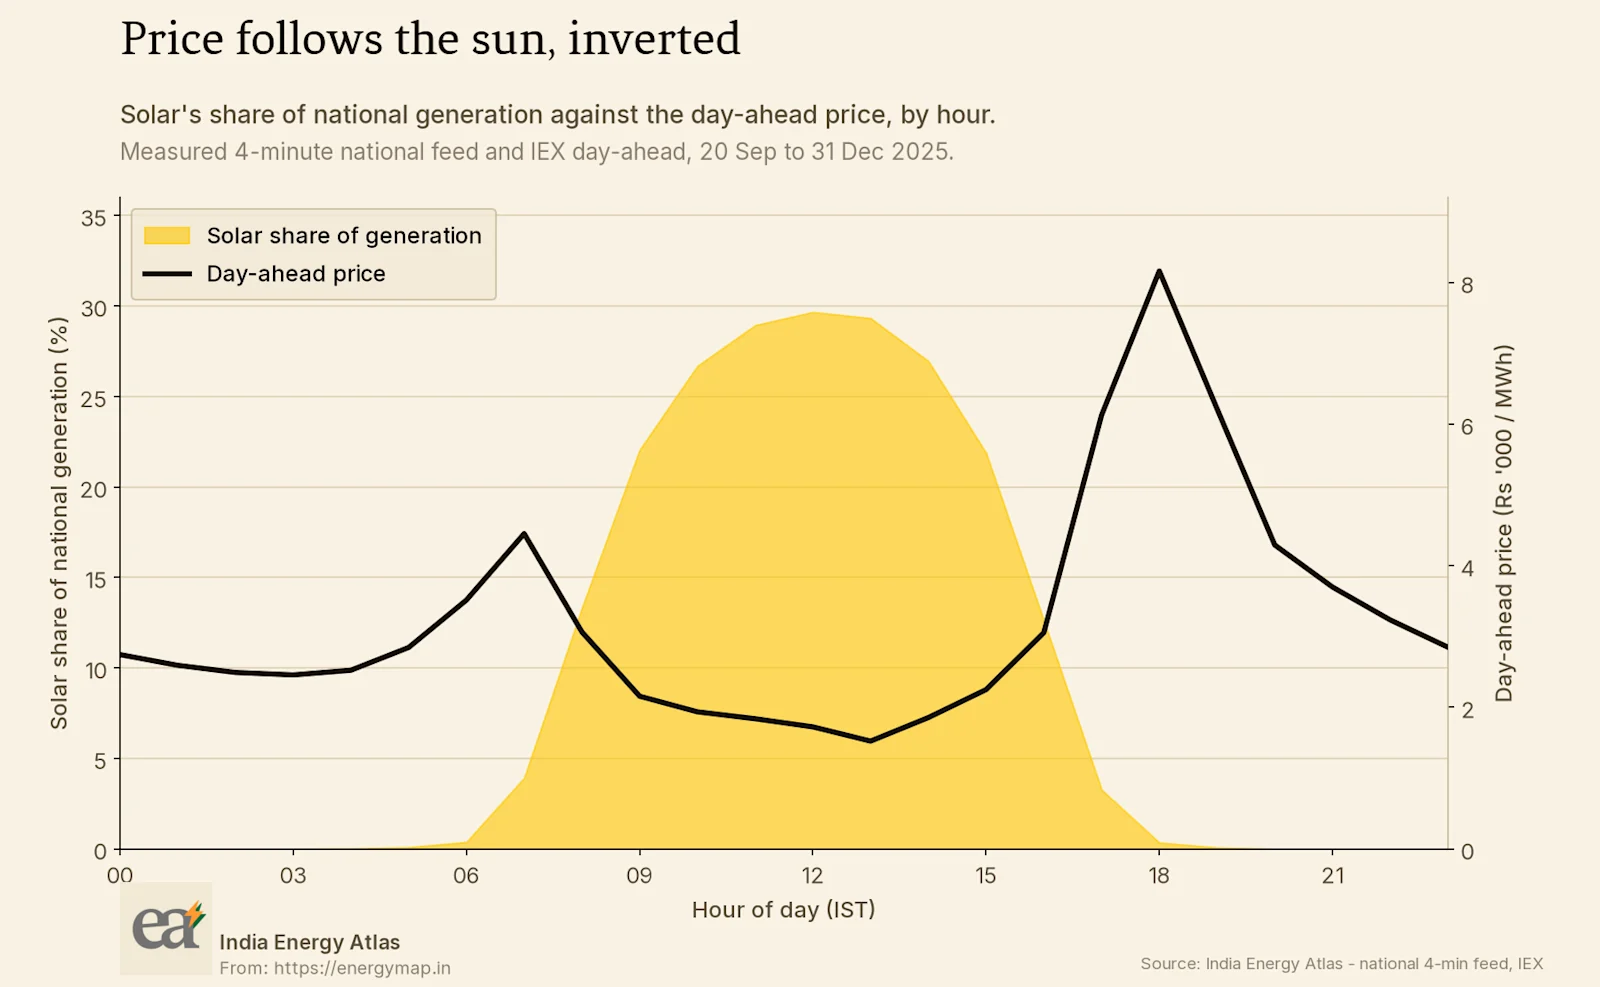
The price traces the inverse of that curve closely enough that I am comfortable calling solar the proximate cause. What I cannot tell from this data alone is how much of the midday decline is solar displacing expensive marginal units and how much is transmission or scheduling constraints preventing cheap midday energy from reaching the buyers who would pay more for it. Separating those two requires nodal data I do not have. I do not know the split.
The evening side of the picture is easier to read. Solar contributes nothing at the hour of the evening peak. Whatever meets that peak has to be dispatchable, and the price reflects the cost of the marginal dispatchable unit rather than the cost of the average unit on the system. Adding more solar capacity does not change that number by itself.
Why point forecasts stopped being useful here #
A single number for the annual average price is now a poor summary of the thing it is meant to summarise. Two projects with identical annual average revenue can have very different economics depending on which hours they generate in. A solar project earns increasingly in the falling half of the day. A peaking asset earns in the half that has held its value.
This is the practical argument for fundamental modelling over price extrapolation. Extrapolating the average forward preserves the level and destroys the shape, and the shape is where the decision lives. A model that dispatches against demand, fuel costs and transmission limits will reproduce the divergence because the divergence is a consequence of dispatch. A model that fits a trend to historical prices will not.
I would add one caveat about the regulatory ceiling. The clearing price cannot exceed the level the regulator sets, which changed during the period I am examining. Scarcity in India is truncated rather than priced, so the evening numbers understate what the market would pay in a genuinely tight hour. Any model that treats the observed evening price as a free-market outcome will underestimate the value of firm capacity.
So what, and for whom #
For a distribution utility planner. The relevant question has moved from how much energy to contract to which hours to contract it in. A long-term agreement priced against a flat block is now a bet that the shape of the day will stop changing. Nothing in this data suggests it will. Reviewing the hourly profile of the existing contract book against the current price shape is a cheap exercise with a large expected value, and the state pages for Rajasthan, Gujarat and Karnataka show how differently this plays out by geography.
For a renewable developer. Merchant revenue assumptions built on a flat capture price will overstate solar returns and understate the value of firming. If a project's business case depends on capturing the annual average price, it is worth restating that case against an hourly profile before committing capital.
For a large industrial buyer. The gap between midday and evening is now large enough that moving flexible load is worth real money, and the move does not require any forecasting skill. A fixed rule that shifts consumption out of the evening block captures most of the available value.
For a regulator. The widening gap is a signal about where firm capacity is scarce. Whether the current market design rewards that scarcity adequately is a policy question I am not going to answer here, but the data makes clear that the scarcity is concentrated in a narrow and predictable set of hours.
The underlying series behind all three exhibits are available through the Atlas data products, and the live market view sits at the IEX market page.
Sources & method
IEX day-ahead clearing prices and cleared volumes, and the measured All-India 4-minute generation feed, both from the India Energy Atlas production series. Price comparison restricted to 1 April to 31 July of each year to remove seasonality. Prices are exchange clearing prices, which are marginal and cover a minority of national supply; they are not average retail tariffs. The regulatory price ceiling changed during the period covered. Cover photograph by Matthew Henry on Unsplash.