

What India's record demand day actually tested
On 21 May 2026 India met its highest ever demand in mid-afternoon, with solar carrying a large share of it. Four hours later that solar was gone and demand had barely fallen.
A stress test the system ran on itself #
On 21 May 2026 the Indian grid met the highest demand in its history. Records of this kind usually generate a round of congratulation and very little analysis, which wastes the most informative day of the year. A record day is an unplanned stress test, conducted at full scale, with complete instrumentation.
I went through the four-minute measured feed for that day to see what was actually tested.
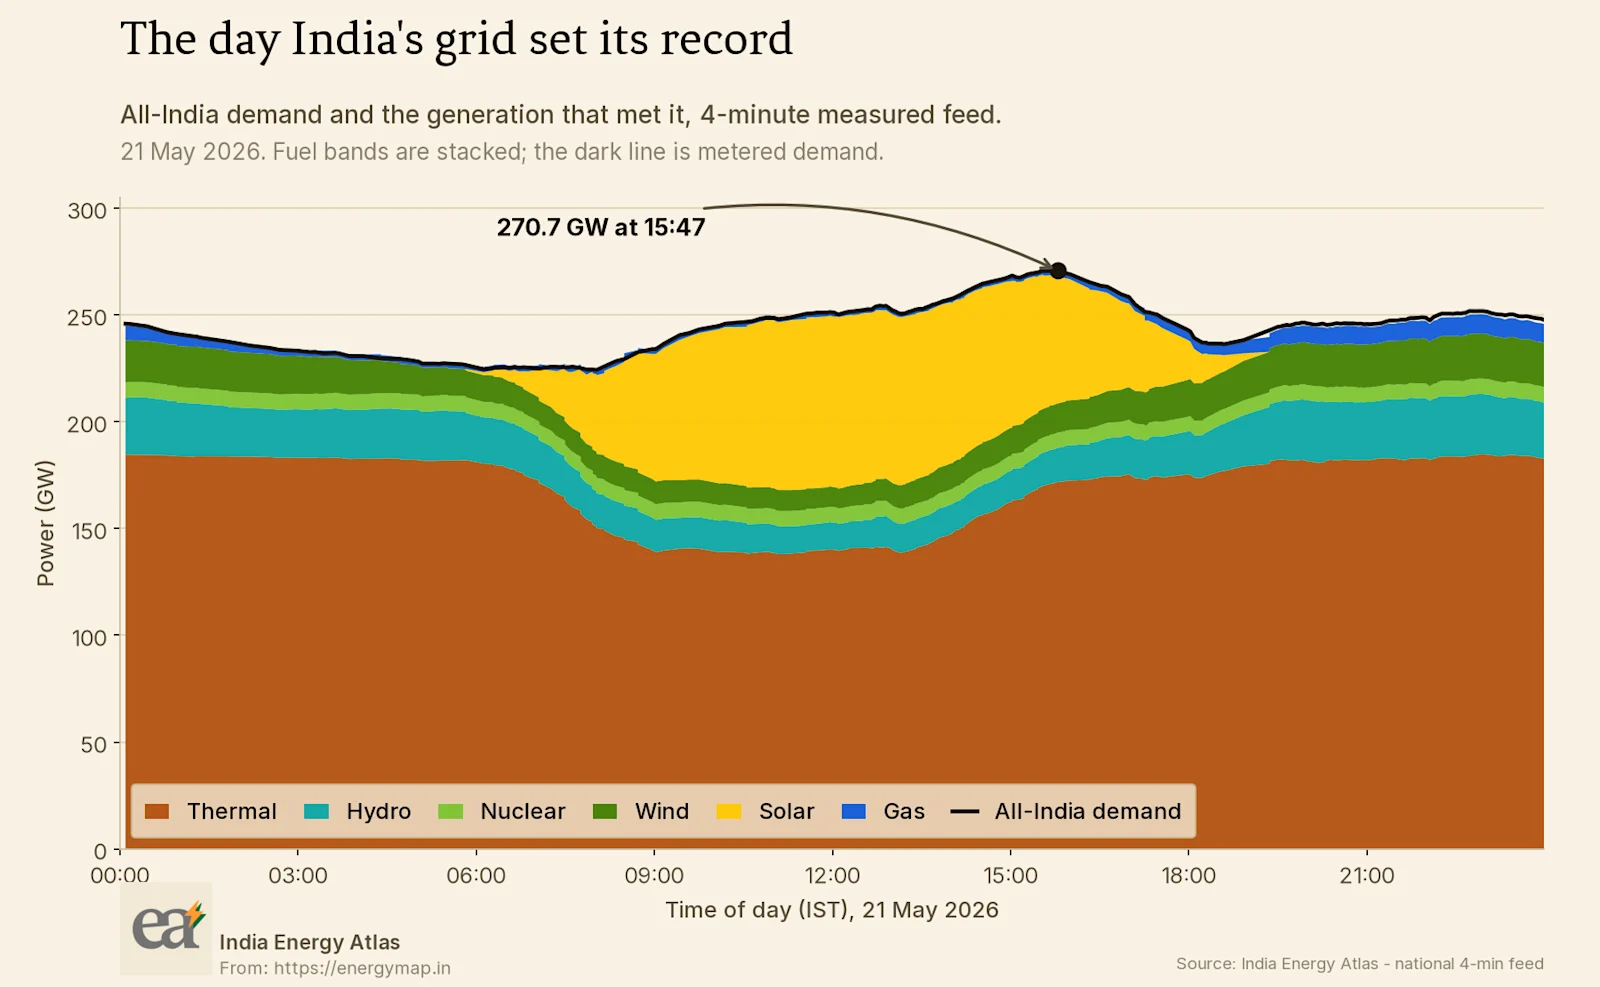
The peak arrived in the middle of the afternoon. Solar was carrying a substantial block of generation at that moment, and the stack shows how much of the afternoon was covered by it.
The hour that was harder #
The record instant is the least demanding part of the day to explain.
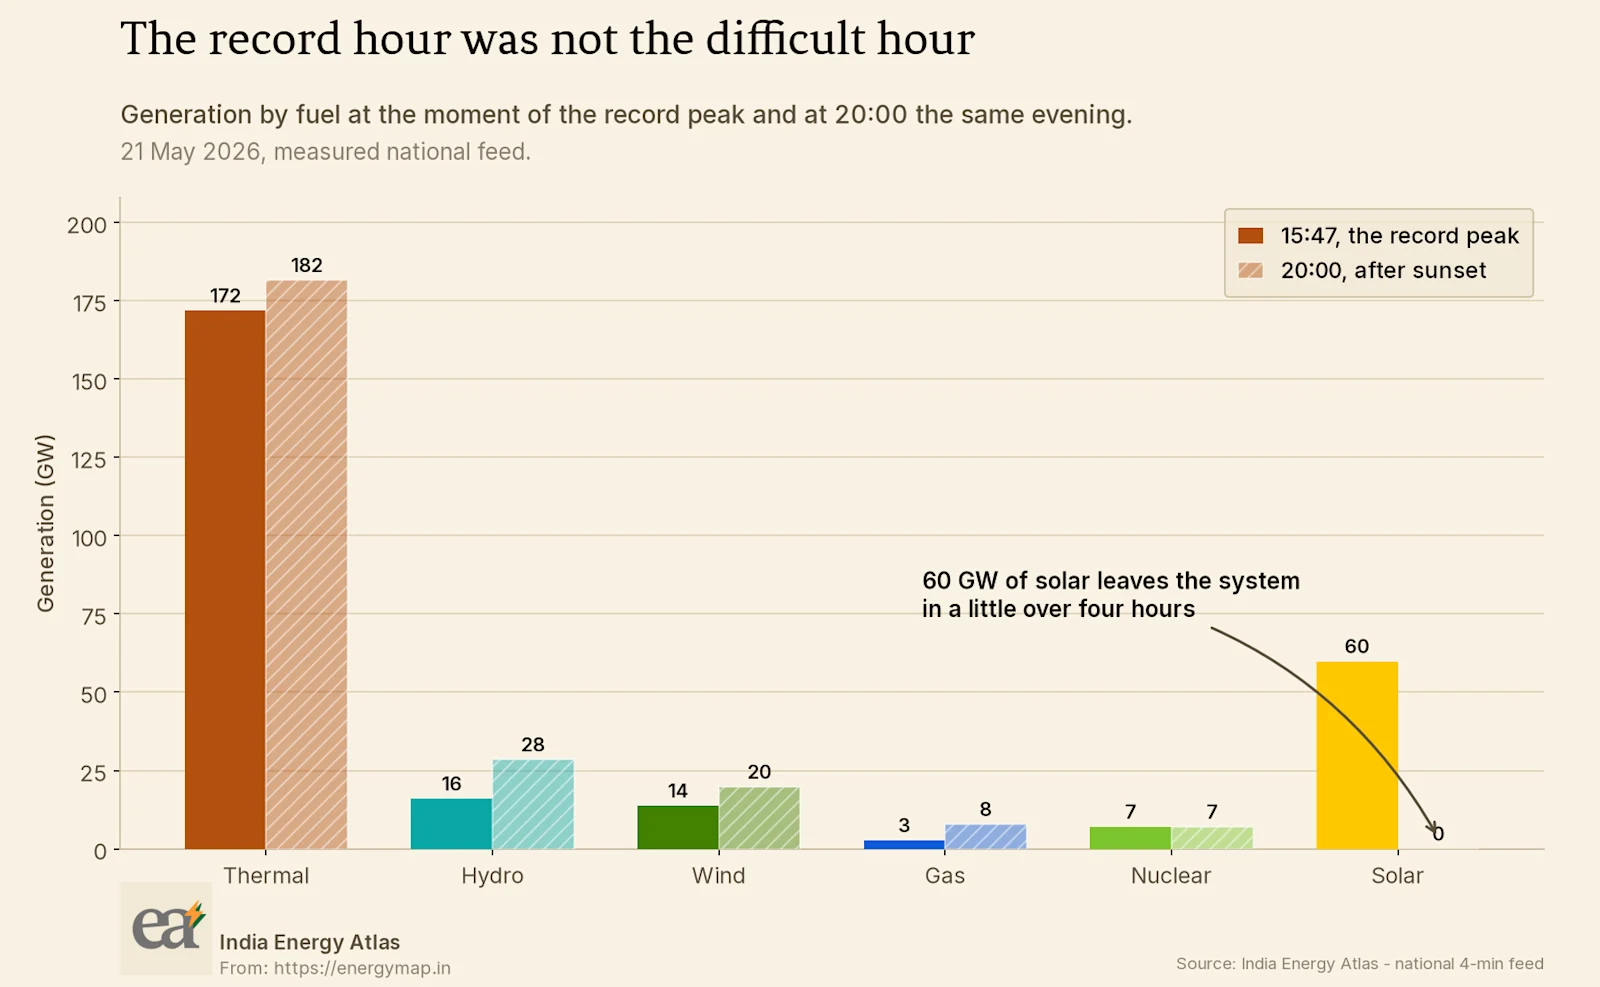
Comparing the moment of the peak with 20:00 that same evening shows what the system actually had to do. Between those two points solar output goes from a very large number to zero. Demand falls from its record level, but it does not fall by nearly as much as solar does. The difference has to come from somewhere, and the exhibit shows where.
Thermal rose. Hydro rose by roughly as much in absolute terms, from a much smaller base, which is the more remarkable operational fact. Gas and wind covered the remainder.
The record hour was met with a large contribution from a resource that was about to disappear. The evening hour was met entirely by dispatchable plant. Both hours were served, and only one of them told the system anything about its dispatchable capability.
A record set at three in the afternoon in May is a measurement of solar. The test happens after sunset.
What I would want to know and cannot #
Several things I would like to establish are not in this dataset.
I do not know how much dispatchable headroom remained at 20:00. Knowing that the fleet delivered its evening output says nothing about how much more it could have delivered, and the margin is the number that determines whether a hotter day would also have been served. That requires unit-level declared capability against actual output, which is not in the national feed.
I do not know how much of the hydro contribution was discretionary. A large evening hydro ramp can reflect operational flexibility or it can reflect a reservoir being drawn harder than its owners would prefer. Those look identical here.
I also cannot say whether the evening was tight in any economic sense on that particular day without reconciling it against the market outcome, and a single day is a weak basis for that claim in any case.
What the data supports is narrower and still useful. The system's dispatchable fleet performed a very large swing in a few hours, and it performs a swing of similar magnitude most days. The record was a demand event. The recurring stress is a ramp event.
Reading a single day honestly #
A single day is a weak unit of evidence and it is worth being explicit about how far one can be pushed.
What a record day establishes reliably is a lower bound on capability. The system delivered this demand, so it can deliver at least this much under these conditions. That is genuinely useful and it is most of what a record tells anyone.
What it does not establish is any margin. Delivering a quantity says nothing about how close the system came to failing to deliver it, and the two questions have very different answers on days that look identical in the metered record. A day with comfortable reserves and a day where several units returned from outage hours earlier produce the same demand curve.
It also does not establish that the conditions were the worst the system will face. A record demand day with good wind and normal hydro availability is easier than a lower-demand day with poor wind, a forced outage at a large station, and a constrained corridor. Those combinations occur, and they do not set records, which is precisely why they receive less attention.
The value of instrumenting a record day carefully is that it calibrates the model rather than that it proves adequacy. A model that reproduces this day, including the evening transition, is a model that can be trusted to explore the days that did not happen.
Why this matters for how the next study is scoped #
Resource adequacy work in India, as in most places, is anchored on the annual peak. That anchoring made sense when the peak hour was also the hour of greatest system stress. On this day those were different hours, and the gap between them is a function of how much solar sits on the system at the time of the peak.
A study that sizes capacity against the coincident peak will size it against an hour when a large block of solar is available. The same study will say nothing about the hour four hours later when that block is gone and demand is still high. As the midday solar contribution grows, those two hours diverge further, and the adequacy question increasingly belongs to the later one.
This is a testable proposition rather than a rhetorical one. Running an adequacy assessment against the evening net load peak instead of the gross demand peak produces a different required capacity, and the difference is calculable from data that already exists.
So what, and for whom #
For a system operator. The daily ramp requirement is the operational variable worth reporting alongside the peak. A day that sets a demand record and a day that sets a ramp record are different days, and the second is the one that constrains commitment decisions.
For a national planner. Restating the adequacy criterion in terms of net load rather than gross demand is the single change that most improves the relevance of the exercise. The data to do it is already collected.
For a storage developer. The gap between the record hour and the evening hour is the product's addressable value, and it is measurable on any day of the year rather than only on record days.
For a state utility. The national picture averages across states with very different profiles. The equivalent analysis for Rajasthan, Gujarat or Karnataka will show a considerably sharper evening transition than the national aggregate does.
The four-minute national feed used throughout is published through the Atlas data products, and the national net load picture is maintained on the duck curve reference page.
Sources & method
Measured All-India 4-minute demand and generation feed, India Energy Atlas production series, 21 May 2026 IST. Peak value cross-checked against the POSOCO daily power supply position for the same date. Across 259 overlapping days the 4-minute feed reconciles to POSOCO daily energy at a ratio of 1.00 and to reported peak within one per cent. Fuel bands sum to metered demand within roughly one per cent. Cover photograph by Ben Kim on Unsplash.