
Storage against scarcity: who clears India's evening wall?
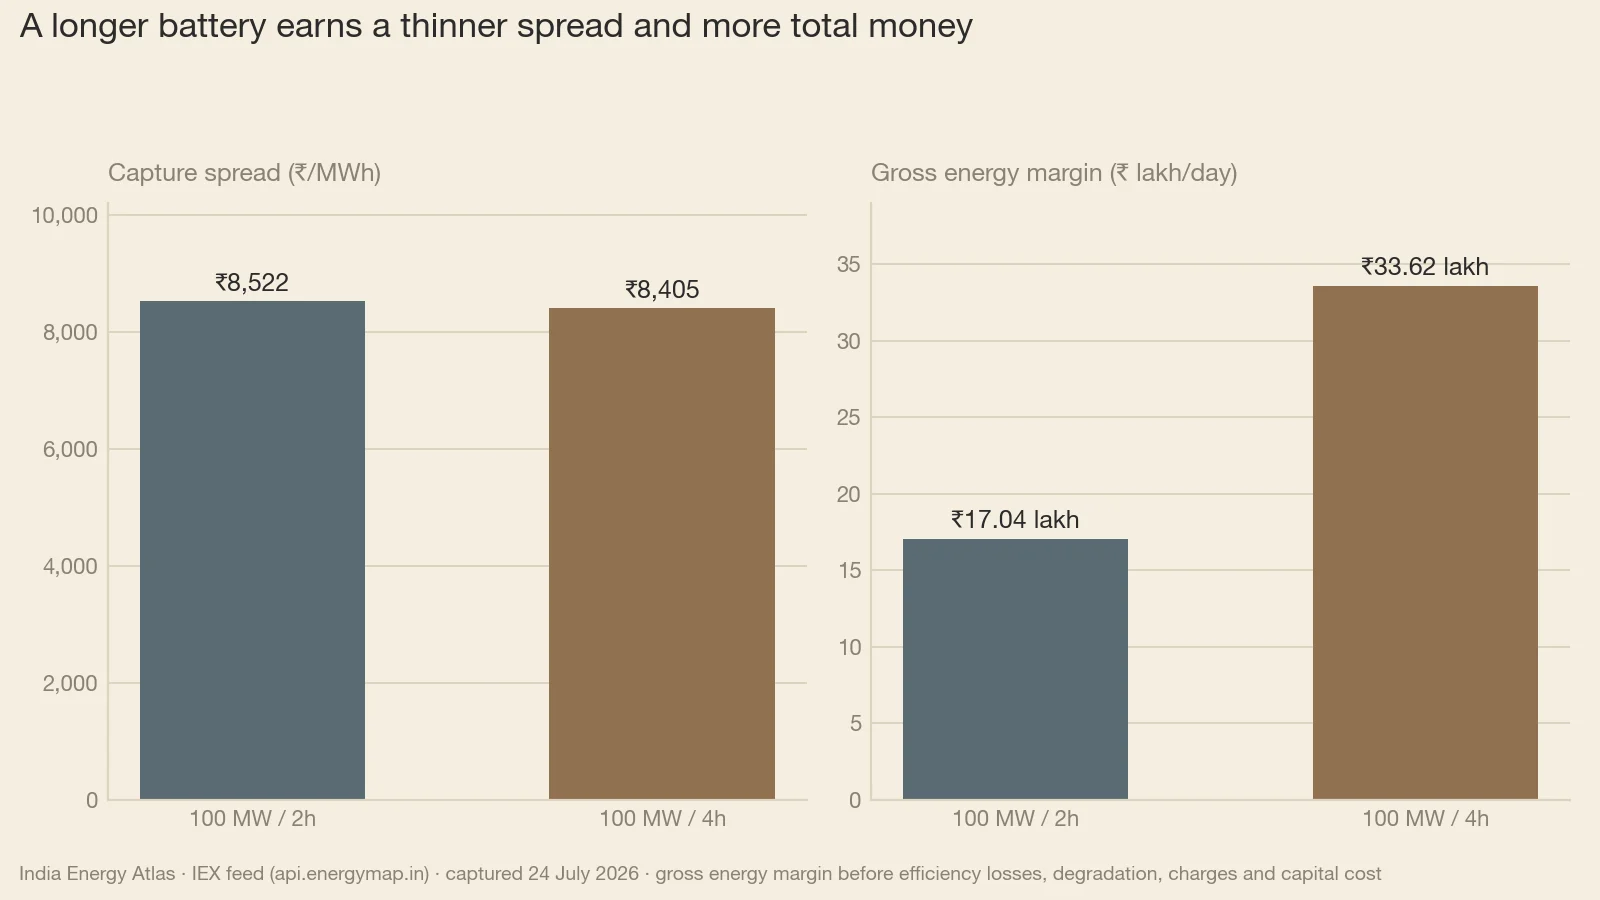
A four-hour battery could have cleared ₹33.62 lakh of gross energy margin in a single July day on India's exchange. The ceiling that makes that trade possible holds 15.2% of the year, and the fleet on the ground is 3.6% of what 2031-32 requires.
Three numbers describe India's evening. They all point the same way, and they disagree about the pace.
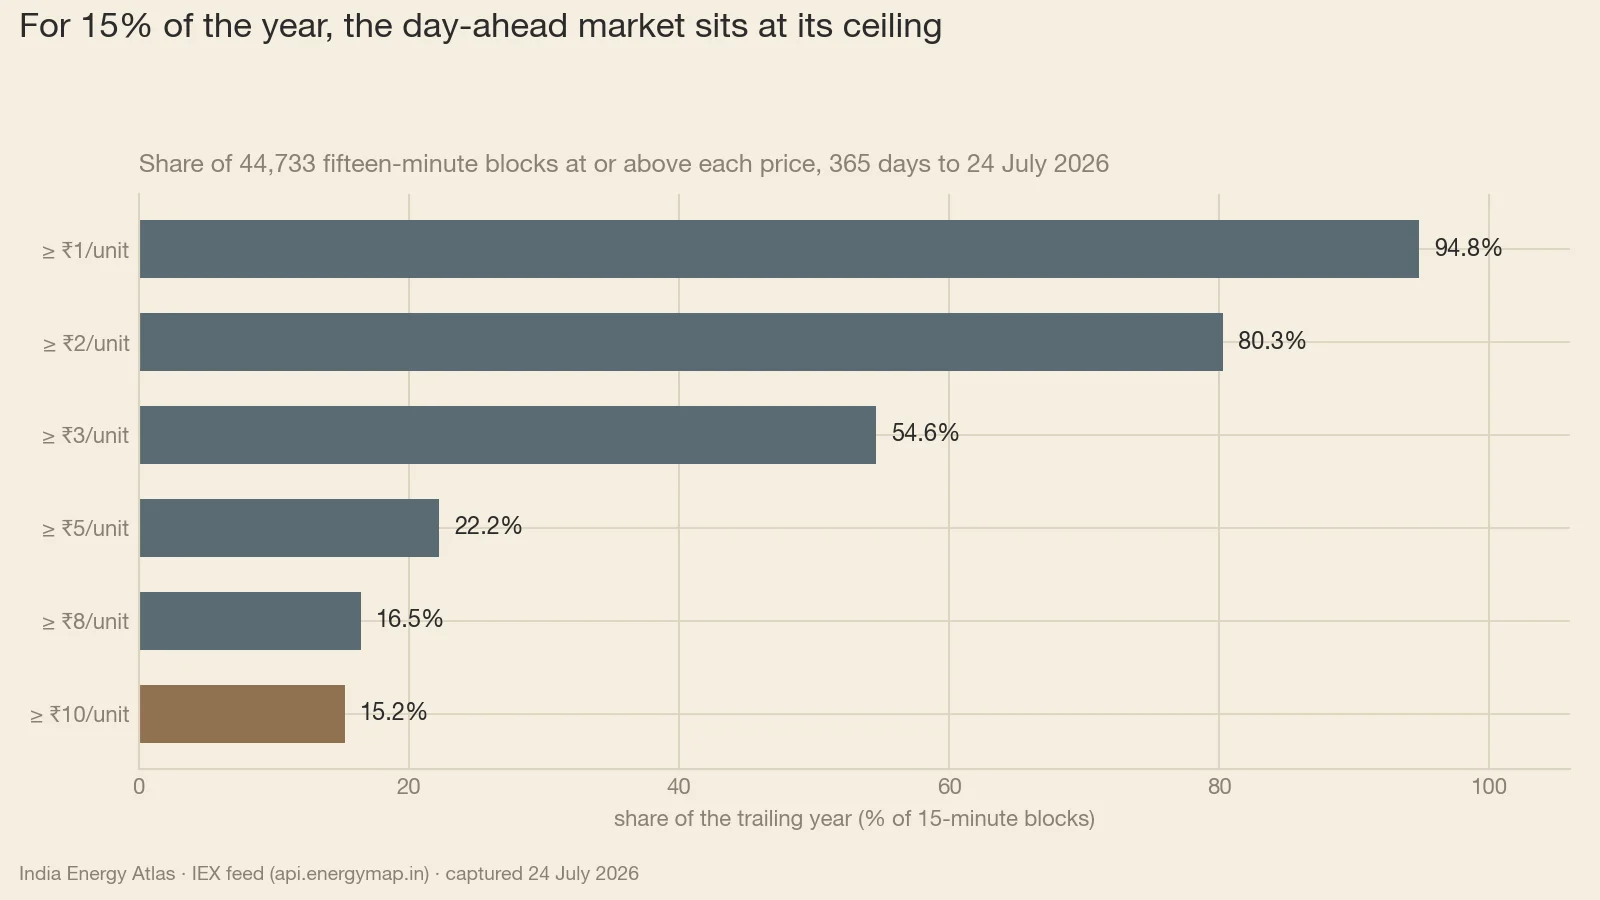
A battery that charges in the midday solar belly and discharges into the evening wall could have cleared something like ₹34 lakh of gross margin on one good July day (Fig. 1). Over a full year, the ceiling price that makes that trade worth doing holds for roughly one block in seven (Fig. 2). And against what the Central Electricity Authority says the country needs by the early 2030s, the fleet actually standing on Indian soil is a rounding error. The arbitrage says build. The price-duration curve says size carefully. The fleet says the evening wall will be cleared by something else for years yet.
The prize: what one good evening pays #
Run a 100 MW battery with four hours of storage against the real day-ahead prints for a single July delivery day. It charges around the midday solar belly at close to ₹1,600/MWh, then discharges into the evening wall at the exchange's administered ceiling. Almost the whole ceiling is margin, and one full cycle is worth about ₹34 lakh in a day (Fig. 1).
The two-hour version of the same asset is the more revealing case. Two hours can be cherry-picked from the very cheapest and dearest blocks, so its spread comes out wider. It still earns roughly half as much, because it cycles half the energy (Fig. 1).
The arithmetic between those two cases is what makes India's evening unusual. The second pair of hours on the four-hour asset captures a price within about three per cent of what the first pair captured. Duration is close to free to add here, because the evening wall is a plateau. Averaged by hour, the day-ahead price sits pinned at the ₹10,000/MWh ceiling for five consecutive hours after dusk, against a trough near ₹1,470/MWh in the early afternoon: a sevenfold swing inside one calendar day. A wall five hours wide pays for a battery's third and fourth hour in a way a one-hour spike never would.
The caveat belongs next to the number. That margin is struck on one delivery day in late July 2026, and it is gross — energy revenue minus energy cost — before round-trip losses, degradation, exchange and transmission charges, levies and capital cost. It illustrates the spread that was available; it is not a revenue line.
The discipline: how often the ceiling actually clears #
Annualise that day naively and a 400 MWh asset earns roughly ₹123 crore a year. The trailing-year data supports no such thing.
Across the trailing year the day-ahead price sat at or above the ₹10/unit ceiling 15.2% of the time — around one block in seven (Fig. 2). Step down from the cap and the curve falls away fast: barely a fifth of the year clears above ₹5/unit, and the annual mean lands near ₹4,100/MWh, a little over a third of the way to the ceiling. The week we sampled was hot and tight, and 37.2% of its blocks cleared at the cap, well over twice the annual share. Sizing a battery off a July week overstates the revenue by construction.
A crude discipline test (modelled): hold the charging leg exactly where the July day put it, and replace the ceiling discharge with the trailing-year mean. The spread collapses to under a third of the July figure, and the same asset earns something nearer ₹10 lakh a day (Fig. 2). The honest answer lives between those two numbers, and where depends on how many evenings a year clear near the cap in the state where the asset stands.
Seasonality decides most of the rest. The twelve-month price curve runs from a post-monsoon low in October to a June high nearly twice as tall, and in every summer month from April through July the upper-quartile block sat at the ceiling. An Indian storage business case is a summer business case carrying an October problem. It should be underwritten on the full price-duration curve, never on a good week — our forward-looking work on that shape sits at /iex-market-forecasts.
The gap: a large tender book and a small fleet #
India's storage pipeline is enormous and its fleet is tiny; the distance between them is the whole story.
The tender book has run far ahead of everything else. Cumulative tendered volume reached 281 GWh by the first half of this year, of which 105 GWh is under execution — awarded, contracted, somewhere short of a live site. Public money has followed: a Union Cabinet outlay of about ₹5,400 crore, approved in May, supports roughly 30 GWh. That is something near ₹1,800 per kWh of supported storage.
What is actually energised is a different order of magnitude. Installed grid battery storage stands at roughly 8.5 GWh, an eleven-fold increase year on year, with about 9.2 GWh more due to commission this year. The Central Electricity Authority projects a requirement of 236.2 GWh by the early 2030s. Today's fleet is 3.6% of that, and this year's commissioning leaves India below a tenth of what it says it needs.
Now the arithmetic, honestly. Closing the remainder by March 2032 needs on the order of 42 GWh a year on a straight line (modelled), four to five times what India will energise this year. The tender book alone is large enough to clear the requirement outright, with volume to spare. Moving it from tender to execution is the binding constraint, and that is a construction and grid-connection problem before it is a finance problem.
A tender is a promise; a commissioned megawatt-hour is a fact. India is long on the first and short on the second.
What the evening wall is actually asking for #
The peak keeps moving. India's official all-time high is 270.8 GW, set on a May evening in 2026, and the record has been reset repeatedly over two years; the Atlas feed tracks a peak just below it. Renewables including hydro met 34% of that record hour, which left something near 179 GW for thermal and hydro plant to hold up in the hardest hour of the year.
Size the requirement against that peak and the ambition becomes legible. Discharged across a four-hour evening window, the CEA target is about 59 GW of power (modelled), a little over a fifth of the record peak. Today's fleet on the same assumption is about 2.1 GW, comfortably under one per cent of it. India is asking storage to go from a rounding error on peak coverage to roughly a fifth of it inside a decade, while the peak keeps climbing.
The geography of that ask shows up in the price shape. Rajasthan, Gujarat and Karnataka carry the deepest midday troughs, which is where charging energy is cheapest and the belly most real. The evening wall is paid for in the load centres — Maharashtra, Tamil Nadu — where the demand sits after the sun has gone. Storage arbitrage is a transfer between those two geographies, and it needs wires to complete it.
Four things that would change the answer #
Commissioning speed. The volume under execution is more than ten times what India will energise this year. Every year that conversion rate holds, the straight line to 2032 gets steeper and the tender book ages.
The price cap. For the sliver of the year the ceiling binds, it truncates the top of the spread, which makes the July number a floor on what evening flexibility was worth (Fig. 2). Re-examining the ceiling would lift the revenue line for storage and the procurement bill for distribution companies in one motion.
Demand response. Load that steps out of the evening wall and into the midday belly captures the same daily spread with no capital cost. Five ceiling-priced evening hours at the seasonal peak are a standing invitation for time-of-day tariffs and interruptible industrial contracts.
Transmission. India mostly clears as one price: only 3.4% of block-area observations diverged from the national clearing price over the trailing month. The exceptions are violent, with a maximum single-area divergence above ₹5,500/MWh. Congestion is rare today, and where it appears it decides which battery earns the spread.
So what — who should act #
For the DISCOM and system planner. Storage covers well under one per cent of the record peak this year on a four-hour discharge assumption. Plan the evening block assuming thermal, hydro and demand response carry it through this decade, and price evening tenders against the ceiling an unhedged position actually faces (Fig. 2); the annual mean will flatter you. Check your own state's load shape on its state page first.
For the IPP and storage developer. Underwrite on the full price-duration curve: the modelled mean-reverted spread is ₹2,506/MWh against ₹8,405 on the best day. Build long: the second pair of hours on a four-hour asset came within three per cent of the first pair, because the wall is five hours wide. Site the charging leg where the belly is deepest, in the solar-heavy west and south.
For the regulator. The ceiling binds about one block in seven across the year, and better than a third of a hot July week. It is the single line item most directly suppressing the storage revenue signal. At the same time, public money is supporting new capacity at roughly ₹1,800 per kWh. Those two instruments pull in opposite directions on the same problem, and deciding which one carries the weight is the live policy question.
For the trader and analyst. Track two series as a pair: the count of capped evening blocks per day, and commissioned gigawatt-hours against tendered ones. The first tells you what the spread is worth today; the second tells you when competition arrives to compress it. With more than a hundred gigawatt-hours under execution against a fleet still in single digits, the compression is scheduled, and it has not started.
Three numbers, one direction, three different clocks. The prize is real, the discipline is arithmetic, and the gap is a decade of construction. Until it closes, India's evening wall will clear the way it has always cleared: with coal, with hydro, and with a price that stops at ₹10.
Sources & method
First-party prices are IEX market clearing prices (MCP) in ₹/MWh read from the India Energy Atlas market feed (api.energymap.in — day-ahead, duck-curve, price-duration, storage-arbitrage and area-price views), captured 24 July 2026. Convention: ₹1,000/MWh = ₹1/kWh = ₹1 per unit; ₹10,000/MWh is the administered exchange ceiling; feed timestamps are UTC and are converted to IST (UTC+5:30), with the evening peak taken as 19:00–23:00 IST. The arbitrage case is a single-day backtest on the 23–24 July 2026 delivery day for a 100 MW asset cycled once, charging across sixteen fifteen-minute blocks in the midday belly and discharging across four evening hours; ₹33.62 lakh and ₹17.04 lakh are gross energy margins — energy revenue minus energy cost — before round-trip efficiency losses, degradation, exchange and transmission charges, state levies and capital cost, and they are not annualisable. Annual shares come from 44,733 fifteen-minute blocks over the 365 days to 24 July 2026 and are reported as percentages of observed blocks, never as absolute hours, because the block set spans multiple price areas. Storage pipeline, Cabinet outlay, installed-capacity and CEA-requirement figures are from public reporting (Energy-Storage.News, Saur Energy, Power Peak Digest); the 270.8 GW peak of 21 May 2026 and the 34% renewable share of that peak are from PIB and Down To Earth, alongside the Atlas-tracked national peak of 269.4 GW. Values labelled modelled — the ₹2,506/MWh mean-reverted spread, the 42 GWh-a-year straight line, and the 59 GW and 2.1 GW power equivalents of GWh figures at four-hour duration — are Atlas arithmetic on the cited inputs, not forecasts. Other derived figures are plain arithmetic on the same inputs and are stated as such in the text: the ₹8,290/MWh incremental capture price is the difference between the four-hour and two-hour cases divided by the 200 MWh between them; ₹1,800 per kWh is ₹5,400 crore divided by 30 GWh; and the ~179 GW non-renewable share of the 21 May 2026 peak is 270.8 GW less the reported 34% renewable-including-hydro contribution.