
The duck curve arrived in India while planning was still about peak demand
Rajasthan's average midday net load is already below zero. The evening ramp that follows now exceeds the state's entire average demand, and no national study describes this.
A curve that arrived without an announcement #
Grid planners in Australia and California have spent a decade discussing what happens when midday solar pushes net load down far enough that the system runs out of things to turn off. The Indian version of this conversation has been mostly about the future.
Looking at state net load profiles, I think the conversation is late. In at least one large Indian state the midday net load is already negative on an average day.
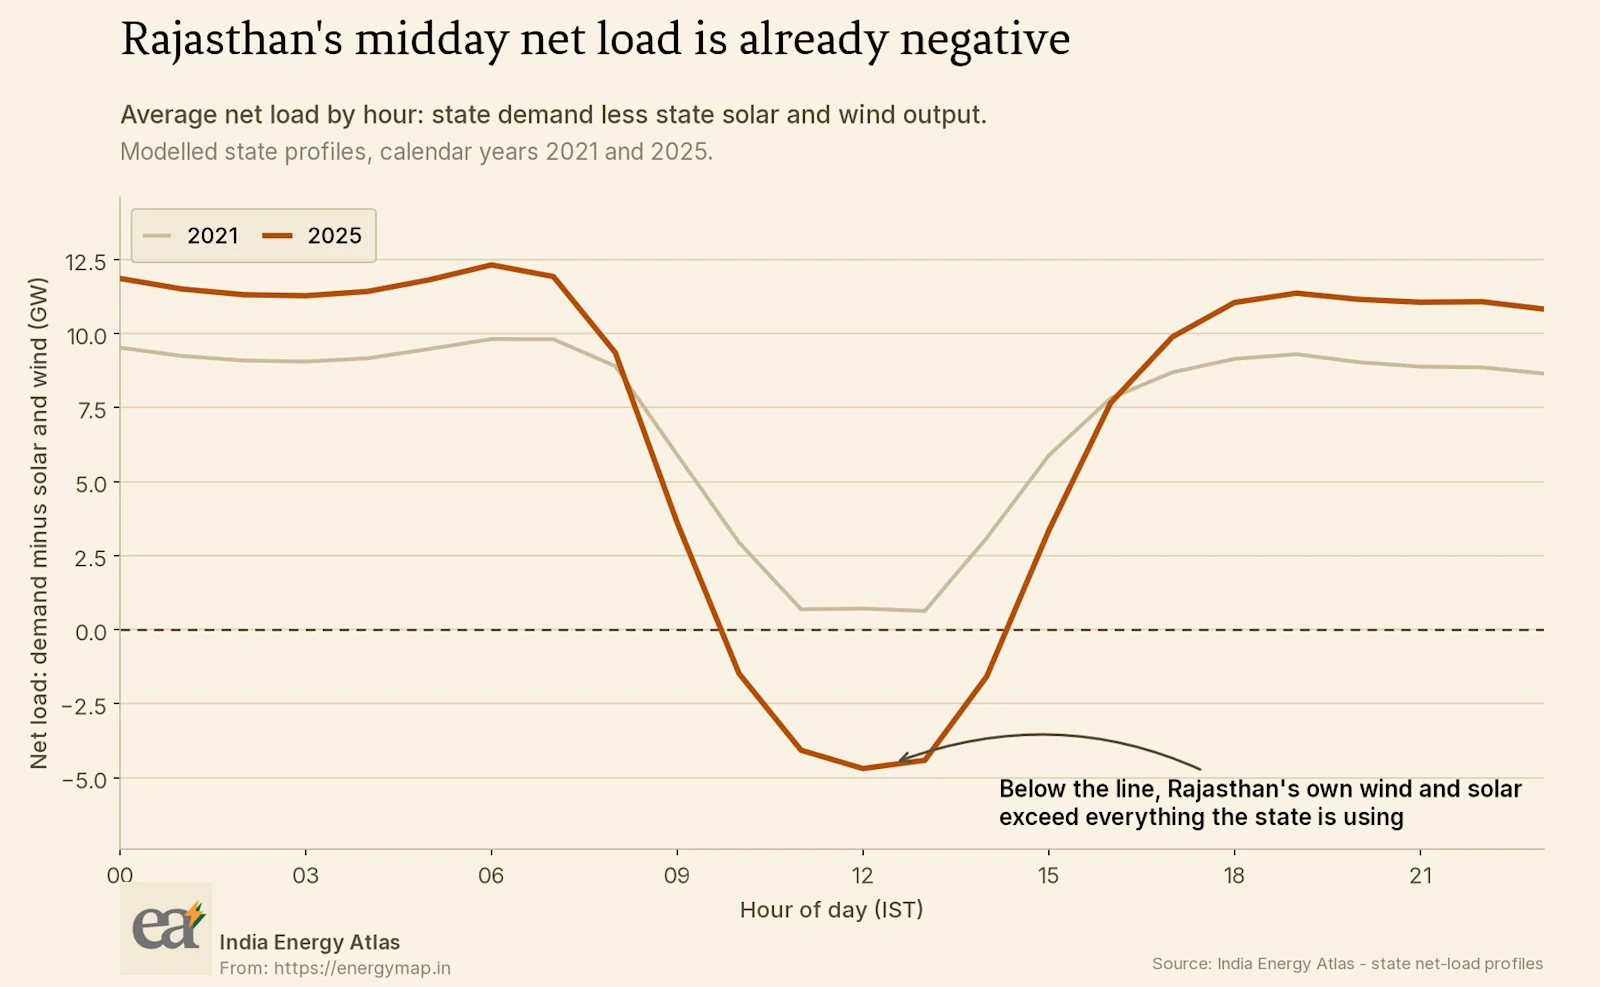
Net load here is the state's own demand less its own solar and wind output. When that quantity falls below zero, the state's renewable generation exceeds everything it is consuming, and the surplus has to leave through the transmission system, be curtailed, or be absorbed by storage that in most cases does not yet exist.
Rajasthan crossed that line between the two years shown. I want to be precise about the caveat: these are modelled state profiles built from metered and reported inputs, not a single revenue-grade meter reading, and the modelling assumptions are documented alongside the series. The magnitude carries more uncertainty than the direction. The direction is not in doubt.
The ramp is the harder problem #
The negative midday number attracts attention, and the evening consequence deserves more of it. A state whose net load bottoms out below zero at noon still has to serve its evening peak a few hours later.
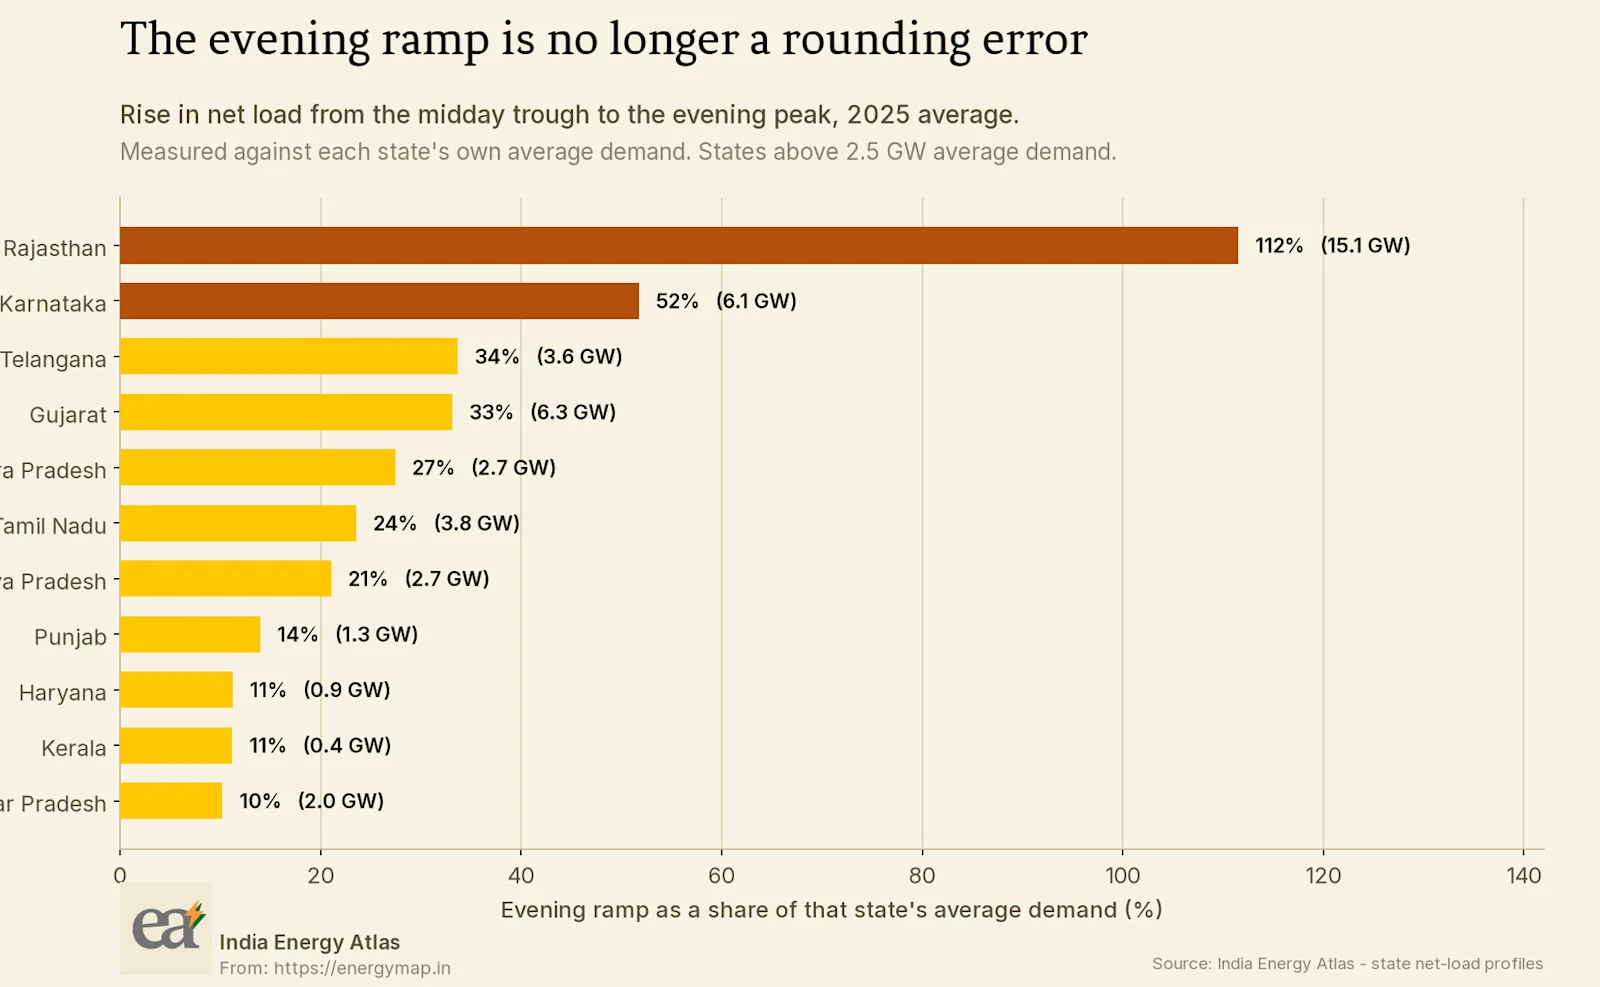
Expressing that rise against each state's own average demand puts states of very different sizes on a comparable footing. For Rajasthan the swing from midday trough to evening peak now exceeds the state's entire average demand. The dispatchable fleet, the imports, or some combination of the two has to deliver that swing every day, and it has to deliver it faster each year as the midday trough deepens.
The depth of the midday trough attracts the attention. The speed of the climb out of it decides what the system has to build.
The same country, different problems #
The most useful thing in this data is how little the states resemble each other.
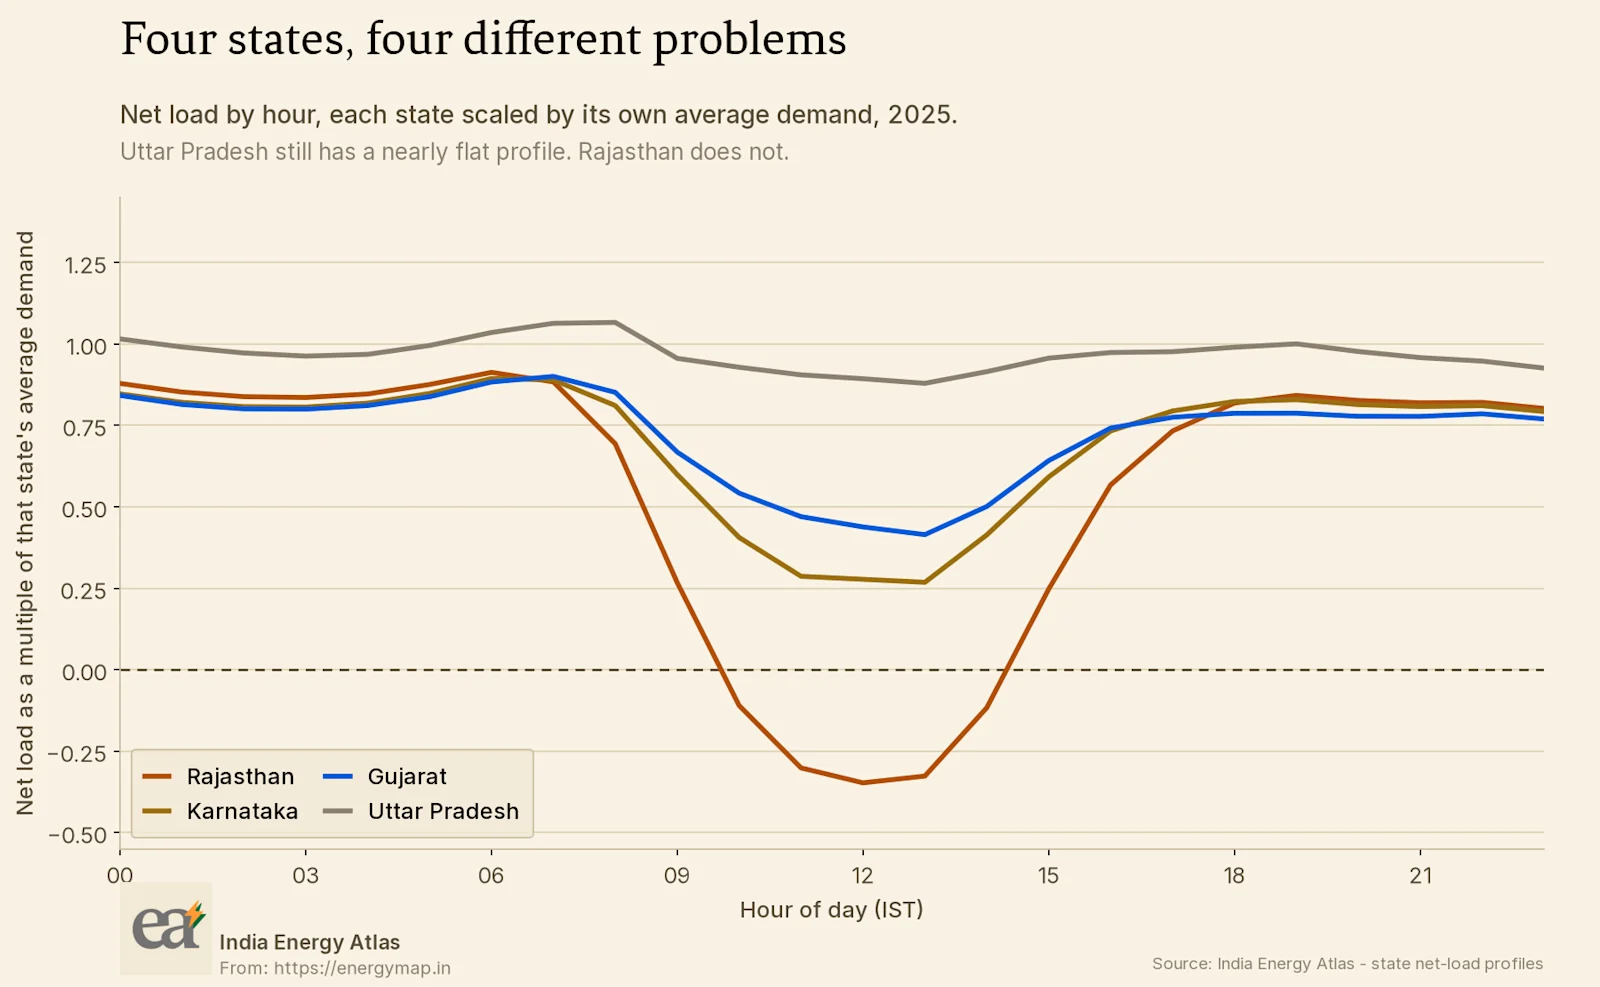
Scaling each profile by that state's own average demand strips out size and leaves shape. Uttar Pradesh still has a profile close to flat, and a planner there is solving a demand growth problem with a familiar structure. Rajasthan is solving something else entirely. Karnataka and Gujarat sit between the two, closer to Rajasthan each year.
A single national resource adequacy study cannot answer the question each of these states is actually asking. A national study will produce a national average that describes none of them well, and the states furthest from the average are the ones with the largest investment decisions in front of them.
What breaks in a model built on the old shape #
Three assumptions that were reasonable when profiles were flat now produce misleading answers.
Peak demand as the sizing variable #
Sizing capacity against the annual peak was defensible when the daily profile was stable and the peak was the binding hour. In a state with deep midday solar penetration, the binding constraint may be the ramp rate rather than the peak level, and a fleet that meets the peak comfortably can still be unable to climb fast enough to reach it.
Minimum demand as a non-event #
The other end of the profile now matters. Falling net load forces thermal units towards technical minimums, and below a certain point the system loses the synchronous generation it relies on for stability. This constraint binds long before the arithmetic suggests, because a unit cannot be dispatched at zero and returned to full output on demand.
Storage as a single number #
Battery capacity is often modelled as a quantity of energy that closes the gap between surplus and deficit. Whether that quantity is sufficient depends on how many consecutive days of poor generation the system has to survive, which is a weather question rather than an arithmetic one. I do not have enough years of high-resolution Indian state data to say how often a multi-day low-renewable event occurs in each state. That is a genuine gap, and it is the kind of gap that only shows up when a model is run against many historical weather years rather than one typical year.
What I would need to say more #
There are three quantities I would want before turning this into an investment recommendation, and I have none of them at the resolution required.
The first is curtailment. A negative net load figure tells me the state generated more than it consumed. It does not tell me whether that surplus was exported, absorbed, or simply not produced because a despatch instruction curtailed it. Those outcomes have very different implications for whether additional capacity is worth building, and I cannot separate them here. I do not know how much midday renewable output is currently being curtailed in Rajasthan.
The second is the intra-state transmission position. A state-level net load figure treats the state as a single node, which it is not. A surplus in one part of the state and a deficit in another can net to a comfortable number while the network between them is constrained.
The third is the multi-day weather sequence. Sizing storage against a typical day is straightforward arithmetic. Sizing it against the worst consecutive run of poor generation days in a decade is the calculation that determines whether the storage is adequate, and it requires many years of consistent high-resolution data. India's record at this resolution is short.
None of these gaps undermine the direction of the finding. All three limit how far the finding can be pushed toward a number.
So what, and for whom #
For a state load despatch centre. The variable worth tracking is the daily ramp requirement rather than the daily peak. If that number is rising faster than the dispatchable fleet's demonstrated ramp capability, the gap has a date attached to it, and knowing the date is most of the value.
For a state regulator. Approving capacity on the basis of a peak demand forecast alone no longer tests the thing most likely to fail. A tariff or procurement order that asks for ramp capability and minimum-load performance is asking about the binding constraint.
For a developer. In the states at the top of the second exhibit, additional unfirmed solar competes with existing solar for a shrinking pool of midday value. The same capital deployed as firming has an increasingly different revenue profile. This is a question worth modelling before siting rather than after.
For a national planner. The dispersion across states is the finding. Any framework that treats the Indian renewable integration problem as one problem with one answer will be wrong in both directions at once, over-investing where the profile is still flat and under-investing where it is not.
The net load series for every state sits behind the Atlas data products, and the national version of this picture, with the mechanism drawn out hour by hour, is on the duck curve reference page.
Sources & method
Modelled state net-load profiles from the India Energy Atlas, calendar years 2021 and 2025, built from metered and reported state inputs. Net load is state demand less state solar and wind output. These are modelled profiles rather than revenue-grade meter readings; the magnitudes carry more uncertainty than the directions. State comparisons are restricted to states above 2.5 GW average demand. Cover photograph by Manny Becerra on Unsplash.