

What the forward curve says about next year's power bill
India's IEX price curve roughly doubles between the post-monsoon trough and high summer, and in all four summer months the top quarter of hours cleared at the administered ceiling. The average is a waypoint; the shape is what a buyer can act on.
India's day-ahead power price averages a little over ₹4,000 per megawatt-hour across the thirteen months to July 2026. No month actually clears there. The average is a waypoint the market passes through twice a year on its way somewhere else — down into the post-monsoon slack, up into a high-summer plateau where the top quarter of hours is rationed at the administered ceiling. A buyer who budgets a whole year at that single figure runs short through every summer month and long through every autumn one. The month-by-month shape of the curve is the part a procurement plan can act on.
The amplitude is worth more than half the average #
The India Energy Atlas price curve assembles thirteen monthly points from cleared IEX day-ahead prices over a twelve-month lookback. The travel around its average is the story of the curve. Monthly prices roughly double between the post-monsoon trough and high summer, and the distance between the cheapest and the dearest month is worth well over half the average itself (Fig. 1).
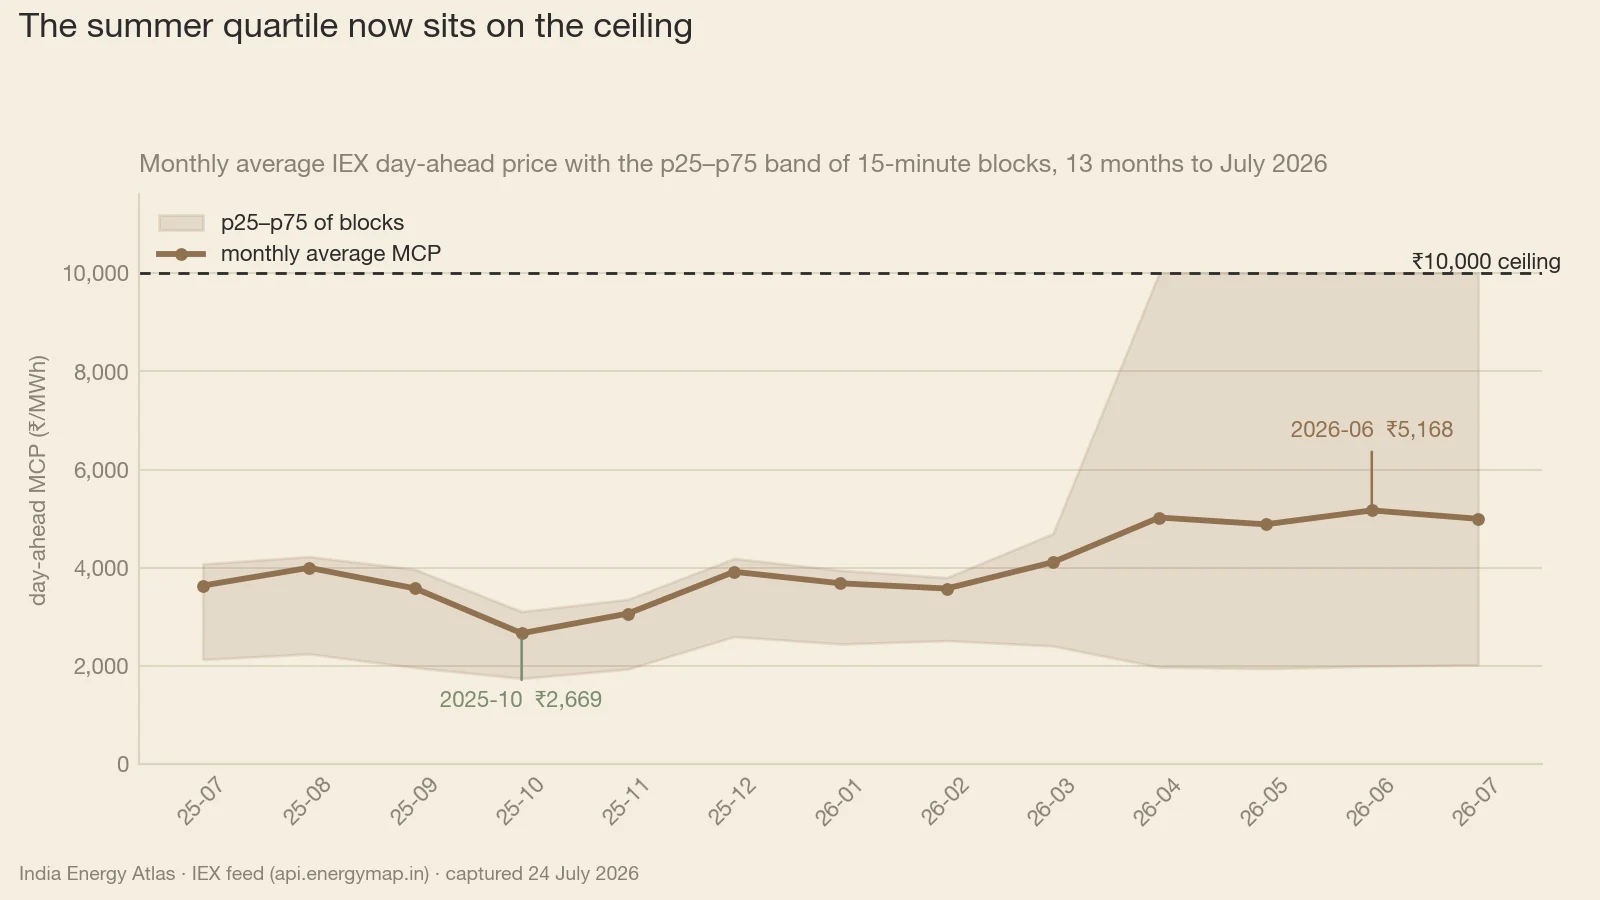
The calendar is legible from the shape alone. Prices run flat and low through the winter, lift in March, then step up hard and hold a plateau for four consecutive months. The peak of the curve sits on the peak of the system: India met an all-time high demand of over 270 GW in high summer. The previous record had stood for less than a month. The trough arrives in October, in the post-monsoon slack.
In every summer month, the top quarter of hours is priced at the ceiling #
Monthly averages hide the mechanism. In each of the four summer months the upper-quartile block cleared at the administered ceiling of ₹10,000/MWh. One hour in four, across a third of the year, was scarcity-priced. The lower quartile in those same months barely moved from around ₹2,000, leaving a single summer month whose dearest quarter of hours clears at about five times its cheapest (Fig. 1).
That dispersion is what separates the mean from the median. June's median block cleared below the thirteen-month curve average even as its mean cleared well above it. The whole of that gap is manufactured by the capped top quarter, and it is the reason a plan built on monthly averages and a plan built on typical hours give different answers.
A summer month on India's exchange is two markets sharing one average: a ₹2,000 solar afternoon and a top quarter of hours rationed at the ₹10,000 cap.
Time of day confirms where the money goes. In the same dataset's block profiles, June's solar windows averaged a little over ₹2,300/MWh while its night blocks averaged close to ₹9,900. Set the dearest month against the cheapest and the asymmetry is stark: their solar windows sit within a few hundred rupees of each other, while their evening blocks are separated by thousands. The seasonal premium is almost entirely a post-sunset premium — which is the block a Maharashtra or Tamil Nadu distribution utility has to cover from somewhere.
The post-monsoon window is genuinely, usefully cheap #
The other half of the shape is the discount. October is the cheapest month on the curve, November the second cheapest and September the third. Taken together, that window sits close to ₹900/MWh below the curve average and about ₹2,000/MWh below June. The same megawatt-hour costs roughly three-fifths as much in the post-monsoon window as it does at the top of summer.
The autumn discount is also the calmest stretch on the curve, which is the property a risk committee should notice. October's entire upper quartile clears below the curve average, and thousands of rupees below the summer upper quartile (Fig. 1). A buyer leaning on the exchange in that window carries a far smaller tail than one who signs a contract to avoid it.
Read this as a seasonal reference, with three caveats #
This curve is backward-looking. Every point in it is an average of prices that have already cleared. No traded instrument stands behind these numbers: no exchange quotes this curve, no counterparty settles against it, and nothing in it guarantees what next summer will clear at. Its usefulness is that the seasonal pattern in Indian power has been repeating and legible. Its limit is that a single policy change, a weak monsoon, or a large tranche of new capacity can break that pattern in one season.
Sampling is uneven. The thinnest month in the window carries little more than a tenth of the blocks the fattest one does, and the closing month is partial to the capture date. Month-to-month comparisons therefore carry unequal weight, and the thinnest months deserve the least confidence.
The ceiling truncates the top. Wherever the upper quartile prints at the cap, the market has stopped discovering the value of those hours. Each summer monthly average is a floor on what an uncapped market would have printed, and the distance above that floor is unobservable from the cleared data.
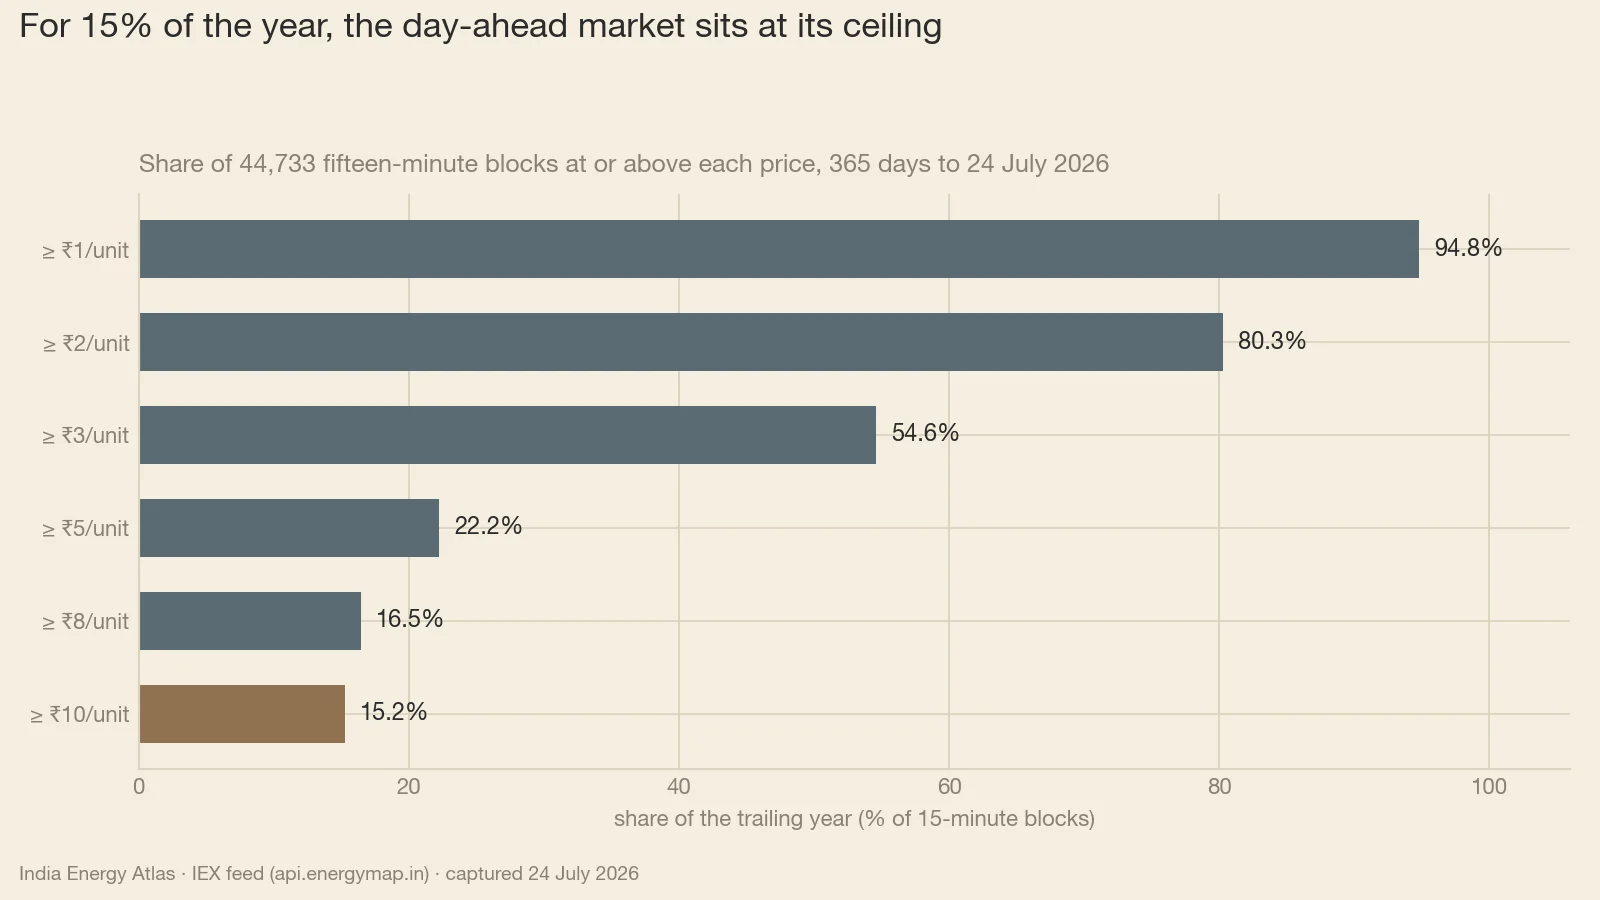
Current prints say the summer pattern is still live. In the delivery week just before capture, the day-ahead mean ran far above the median, with well over a third of blocks stuck at the ceiling. Over the trailing year the cap bound roughly one hour in seven, and more than a fifth of the year cleared at or above ₹5 a unit (Fig. 2).
Sizing the bill: what the shape costs a 100 MW block #
A modelled illustration makes the amplitude concrete. Take 100 MW held flat across a thirty-day month and price it at the curve's own monthly averages — gross energy cost only, before transmission charges, losses, exchange fees and any contracted volume. Priced at June, that block costs about ₹37 crore. Priced at the curve average it costs ₹29 crore, and priced at October, ₹19 crore (all modelled).
Planning at the average therefore understates a June bill by roughly ₹8 crore and overstates an October one by nearly ₹10 crore. Those two errors do not cancel in any month a treasury actually has to fund. Scaled across the whole four-month summer plateau, the modelled miss on 100 MW held flat runs to something close to ₹29 crore of gross energy exposure that a flat annual assumption never books.
A real distribution utility does not buy a flat block, and its exchange exposure is the residual left after long-term contracts have run. The point survives the simplification: that residual sits in the evening and night hours, which is exactly where the curve says the cap is binding.
So what — who should act #
For the DISCOM and system planner. Budget by month. A tariff petition or a power-purchase plan built on the curve average carries close to ₹1,000/MWh of unfunded cost in every summer hour it leaves to the exchange. The actionable split is narrow: contract or hedge the April–July evening and night blocks, where the upper quartile is pinned at the cap and the night average sits just under it, and leave the September–November window and the year-round midday solar block open to the market, where the lower quartile stays near ₹2,000 even in June. Check where your own state's peak actually lands, whether that is Delhi or Uttar Pradesh, against the hourly shape on /iex-market.
For the IPP and storage developer. The widest spread on the calendar is April to July: charge near the ₹2,000 lower quartile in the solar window, discharge into hours the upper quartile says clear at the cap. Solar-heavy Rajasthan and Gujarat offer the deepest midday troughs to charge into. Two disciplines apply. First, the cap clears only about one hour in seven across the year (Fig. 2), so a four-month spread cannot be annualised at summer rates. Second, autumn evenings clear thousands of rupees below summer evenings, so revenue modelled at a flat annual spread will overstate the asset by a wide margin.
For the regulator. Four consecutive months with the upper quartile at the administered ceiling makes the cap a seasonal feature of the Indian market, well outside the emergency conditions a ceiling is normally designed for. Two questions follow. Does a truncated summer price still convey enough signal to attract the evening capacity the curve says is scarce? And should a published, standardised seasonal reference curve become part of tariff and procurement review, so that a DISCOM plan is tested against a summer month and an autumn month, each on its own terms?
For the trader and analyst. Track the running month's upper quartile as the lead indicator; the mean lags it. Between March and April the upper quartile jumped clean onto the ceiling, a step change the monthly average registered as a modest lift (Fig. 1). Upper-quartile pinning is the cleanest read that a month has turned scarce, because it registers the turn at full scale while the average dilutes it across cheap solar hours. Our forward-looking price work sits at /iex-market-forecasts.
The average tells you what a year of Indian power costs. The shape tells you when to buy it.
Sources & method
Prices are IEX market clearing prices (MCP) in ₹/MWh read from the India Energy Atlas market feed (api.energymap.in), captured 24 July 2026. The monthly curve is the Atlas forward-looking price view: 13 monthly points (July 2025 to July 2026) built from cleared day-ahead prices over a 12-month lookback, reporting each month's average, median, quartiles, extremes and standard deviation, plus time-of-day block profiles (solar, off-peak, evening, night). Convention: ₹1,000/MWh = ₹1/kWh = ₹1 per unit; ₹10,000/MWh is the administered ceiling; underlying timestamps are UTC and converted to IST (UTC+5:30). Weekly day-ahead statistics cover 400 fifteen-minute blocks across the 20–24 July 2026 delivery days; annual price-duration figures cover 44,733 fifteen-minute blocks over the trailing 365 days and are reported as percentages of observed blocks, since the block set spans multiple price areas. National peak demand figures are from PIB and Down To Earth. CAVEATS: this curve is backward-looking and descriptive — it is a seasonal reference built from prices that have already cleared, not a traded forward contract, not a quoted or settleable instrument, and not a guaranteed forecast of 2027 prices. Monthly sampling is uneven (765 blocks in July 2025 against 7,296 in April 2026; July 2026 is partial at 2,304 blocks to the capture date), so months carry unequal weight. Where the upper quartile prints ₹10,000 the ceiling truncates price discovery, making those monthly averages a floor on an uncapped outcome. The 100 MW flat-block figures are modelled illustrations of gross energy cost at the curve's own monthly averages, before transmission charges, losses, exchange fees, contracted volume and any shaped procurement.