
India's camel curve: how solar bent the price day
India's day-ahead price day now has two humps and a deep midday belly: power is cheaper at one in the afternoon than at three in the morning, and pinned at the ₹10,000/MWh ceiling for five straight hours after dark. Solar drew the shape.
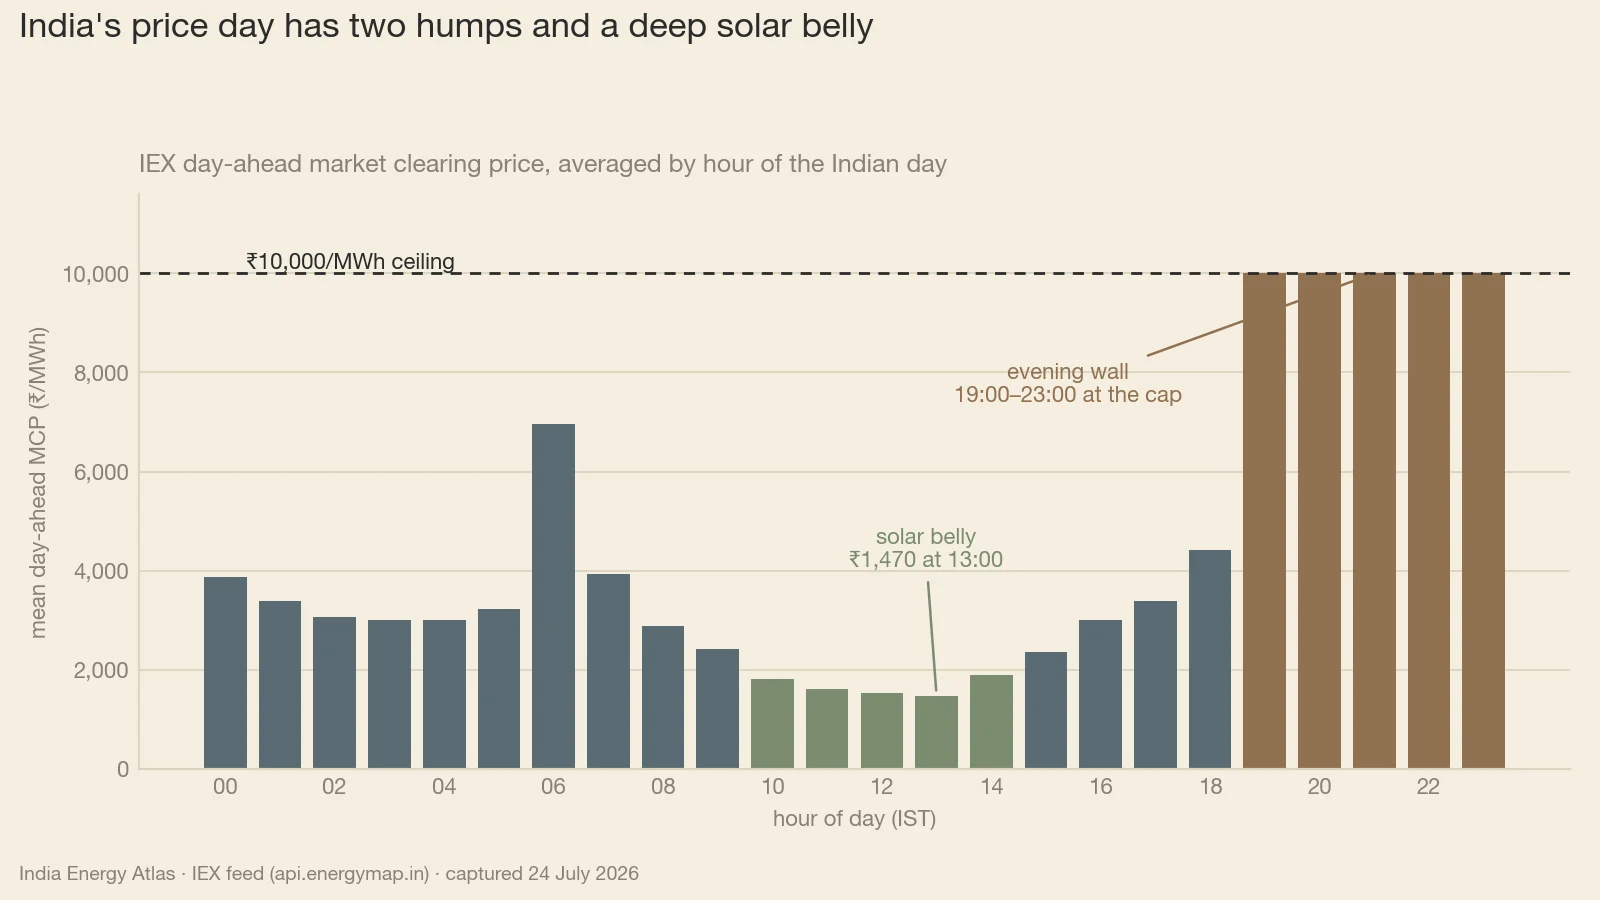
Average India's day-ahead clearing price by hour of the Indian day and a shape appears. In the middle of the afternoon the market clears at about ₹1,500 per megawatt-hour. By seven in the evening it is pinned at the regulatory ceiling of ₹10,000, and it holds there until nearly midnight. A hump before dawn, a deep belly at noon, a wall after dark — close to a sevenfold swing between the cheapest and the dearest hour of one calendar day. The profile is a camel, and solar drew it.
The ladder, hour by hour #
The ladder is easier to see than to recite, which is what Fig. 1 is for. Take the ninety-six fifteen-minute day-ahead blocks of a July delivery day, average them into hours of Indian Standard Time, and the day falls into four movements.
The first is a hump that arrives before the sun has done any work. Six in the morning is among the dearest hours on the board, close to ₹7,000/MWh, printed while photovoltaic output is still negligible. The second movement is the fall, and it is quick: by mid-morning the market has given back most of that hump, and it keeps going.
The third movement is the belly. From late morning to mid-afternoon every hour clears under ₹1,900/MWh, and the trough at one o'clock is the cheapest print of the day. The fourth is the wall. The climb back out is slower than the fall — the market spends a whole afternoon recovering ground it lost in three hours — then covers the last of the distance in sixty minutes. Between six and seven in the evening the price more than doubles, lands on the ceiling, and stays there for five consecutive hours.
One comparison makes the belly's depth concrete. At three and four in the morning — minimum load, no solar at all, the country asleep — the market averages ₹3,000/MWh. At one in the afternoon, with offices, factories and pumpsets all running, it averages half that. Demand does not explain the difference. Solar does.
The surrounding week was not a cheap one. Across the five delivery days around it the mean day-ahead price was about ₹5,600/MWh, and more than a third of all blocks were pinned at the ceiling. The belly and the wall live inside the same five days.
Why India got a camel where California got a duck #
The silhouette has a well-known ancestor. The duck curve — one long midday belly, one steep neck rising into the evening — became the standard picture of what large-scale solar does to a power system's net load. India's version carries a second hump before the belly, and the hump is the part worth studying.
06:00 IST is India's other peak. It prints several times the midday trough and runs well clear of the early-evening shoulder, because that hour stacks agricultural pumping, early industrial shifts and waking residential load on top of one another while photovoltaic output is still close to zero. The generation that serves it is the same thermal and hydro fleet that will be called again after dark, and it is being paid accordingly.
The belly is solar doing its job and then some. Through the middle of the day, utility-scale plant across Rajasthan, Gujarat and Karnataka bids into a market that has already been served. Price falls until the marginal seller stops offering. The exchange's task in those hours is to find somebody willing to take the energy at all, and the trough is what that costs.
The wall is the same solar leaving. Between six and seven in the evening photovoltaic output collapses toward zero while air-conditioning, lighting and commercial load in Maharashtra, Delhi and Tamil Nadu are still climbing. The system has one hour to replace the whole of the day's solar with plant that can still be there at nine at night. It pays the ceiling for that hour, and for the four that follow (Fig. 2).
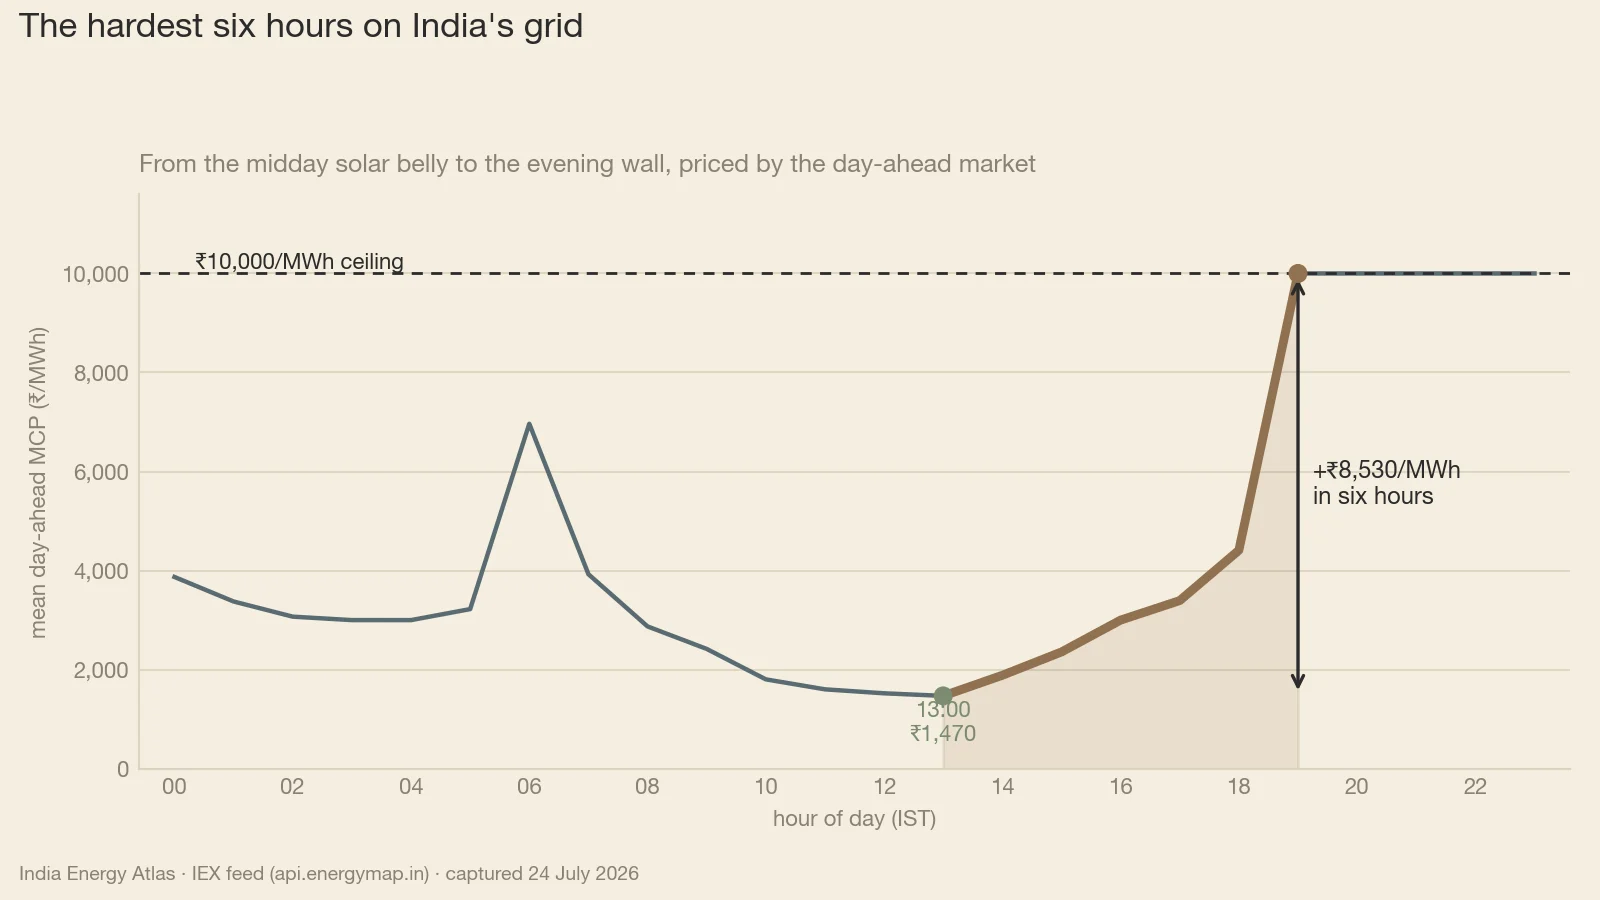
Solar moved the price of Indian power out of the middle of the day and stacked it into the four hours after dark.
The camel grows and shrinks with the season #
A single day gives the shape; twelve months give its behaviour. The Atlas forward-curve view buckets blocks by time of day, and the separation between the solar-hour bucket and the evening bucket is the cleanest measure of how pronounced the camel is in any given month.
In midwinter the two buckets sit close together: evening power runs roughly two-fifths dearer than solar-hour power. By May evening power costs close to four times as much, and the gap between the buckets has widened more than threefold, from under ₹2,000/MWh to around ₹6,000. Nothing changed on either side of that gap in the meantime. Same plant, same panels, same wires — only the season.
The hardening shows in the tails as well. In every summer month from April to July the upper-quartile block sat exactly at the administered ceiling, which is to say the top quarter of all summer hours was scarcity-priced. In those same months the typical evening block cleared there too: median and extreme had converged on the same number. Monthly averages climbed from about ₹2,700/MWh in the post-monsoon slack of October to roughly ₹5,200 at the June peak.
So the camel is a summer animal. From December through February the humps sag toward the belly and the day flattens toward a plateau: winter irradiance is lower and the load composition is different. From March the separation reopens, and by May the shape is at its most extreme.
What a price curve measures, and what it leaves out #
The curve above is a price curve. It reads net load — demand minus whatever solar and wind have already supplied — through the bidding behaviour of a marginal market. Three cautions belong beside it.
Gross demand barely moves across the swing. The Atlas state demand series is modelled, and it is a separate measurement from the price feed. In Delhi, modelled hourly demand at nine in the evening runs 1.4% above the one-o'clock figure. In Tamil Nadu the same two hours land within half a percent of each other. Demand is close to flat between the cheapest and the dearest hour of the day; the swing is written entirely on the supply side.
The day-ahead print carries a scheduling premium. On the same delivery day the real-time market averaged about ₹1,500/MWh below day-ahead, and it was the cheaper of the two in every one of the day's ninety-six blocks. Over a wider sample, real-time touched the ceiling roughly half as often as day-ahead did. The camel is steepest in the day-ahead print and shallower in real time.
One hot week is a seasonal reading. Across the trailing year the day-ahead price sat at or above the ceiling about one block in seven, at a mean of roughly ₹4,100/MWh — well under this July week's. July is the seasonal maximum of the shape. The year-round profile is flatter, and long-term PPA volumes never see this print at all.
So what — who should act #
For the DISCOM and system planner. Procure by hour. In this July week the midday block was available for a small fraction of what the evening block cost, and a tender priced off the ₹5,600 weekly mean buys a portfolio that exists in neither window. Move every shiftable load you control — irrigation feeders, water pumping and treatment, EV depot charging, campus thermal storage — into the late-morning-to-mid-afternoon band, where four hours a day clear under ₹1,900/MWh, then hedge the evening block explicitly. Pull the hourly shape from /duck-curve before the next tender round, and carry the five ceiling hours through evaluation as their own line item with their own price.
For the IPP and storage developer. The market is paying for time-shift: the same megawatt-hour is worth about ₹1,500 in the middle of the day and ₹10,000 after dark. Two design consequences follow. First, size discharge duration against the width of the wall — it is five hours wide on this day, so a two-hour asset leaves three ceiling hours uncovered. Second, temper the arithmetic. The cap clears only about one hour in seven across the trailing year, so anchor the business case to the full price-duration curve, which a single July evening flatters. Siting is a smaller lever than it looks: India cleared as one national price for all but a few percent of block-area observations this past month, so a battery in coal-heavy West Bengal sees much the same belly and wall as one in Rajasthan. Connection, land and charging source decide the address.
For the regulator. The asymmetry is now measurable, and it is seasonal: an evening-to-solar-hour price ratio near 1.4× in midwinter, close to 3.9× by May. Time-of-day tariffs, ancillary services procurement and ramping products set on an annual cycle will mis-price a shape whose evening-to-midday gap more than triples between midwinter and early summer. An upper quartile pinned at the ceiling for four months running says something further: the cap is binding for a quarter of all summer hours, which sits well outside the emergency conditions a ceiling is designed for.
For the trader and analyst. The informative hour is the one between six and seven in the evening. Track two series separately — the width of the ceiling window, meaning how many consecutive hours print ₹10,000, and the depth of the belly, meaning the one-o'clock average. They move for different reasons: width tracks evening capacity adequacy, depth tracks solar build-out. A monthly average blends the two into a single number that hides both. Our forward-looking work sits at /iex-market-forecasts.
India has built enough solar to give itself a cheap afternoon. The ₹10,000 evening is what it has to buy next.
Sources & method
Prices are IEX market clearing prices (MCP) in ₹/MWh read from the India Energy Atlas market feed (api.energymap.in — its duck-curve, day-ahead/real-time, price-duration and forward-curve views), captured 24 July 2026. The hourly profile averages the 96 fifteen-minute day-ahead blocks of the 23–24 July 2026 delivery day into hours of Indian Standard Time; feed timestamps are UTC and are converted at IST = UTC+5:30. Weekly statistics cover 400 day-ahead and 400 real-time blocks across the 20–24 July 2026 delivery days; annual statistics cover 44,733 fifteen-minute blocks over the trailing 365 days; seasonal statistics come from a 13-month monthly series with time-of-day buckets (solar, off-peak, evening, night) as labelled in the Atlas forward-curve view. ₹1,000/MWh = ₹1/kWh = ₹1 per unit, and ₹10,000/MWh is the administered ceiling. State hourly demand figures are MODELLED (Atlas modelled state demand series, 168 hourly points per state covering 17–23 July 2026) and are a separate measurement from the price feed. Percentages of time are reported as a share of observed blocks; absolute hour counts are deliberately not given because the block set spans multiple price areas. Caveat: this is a price curve and therefore a proxy for net-load shape, driven by the marginal megawatt cleared on the exchange; long-term PPA volumes sit outside this print, and a single July delivery day represents the seasonal maximum of the shape, with the year-round average being flatter.