

The three-hour ramp: India's hardest hours
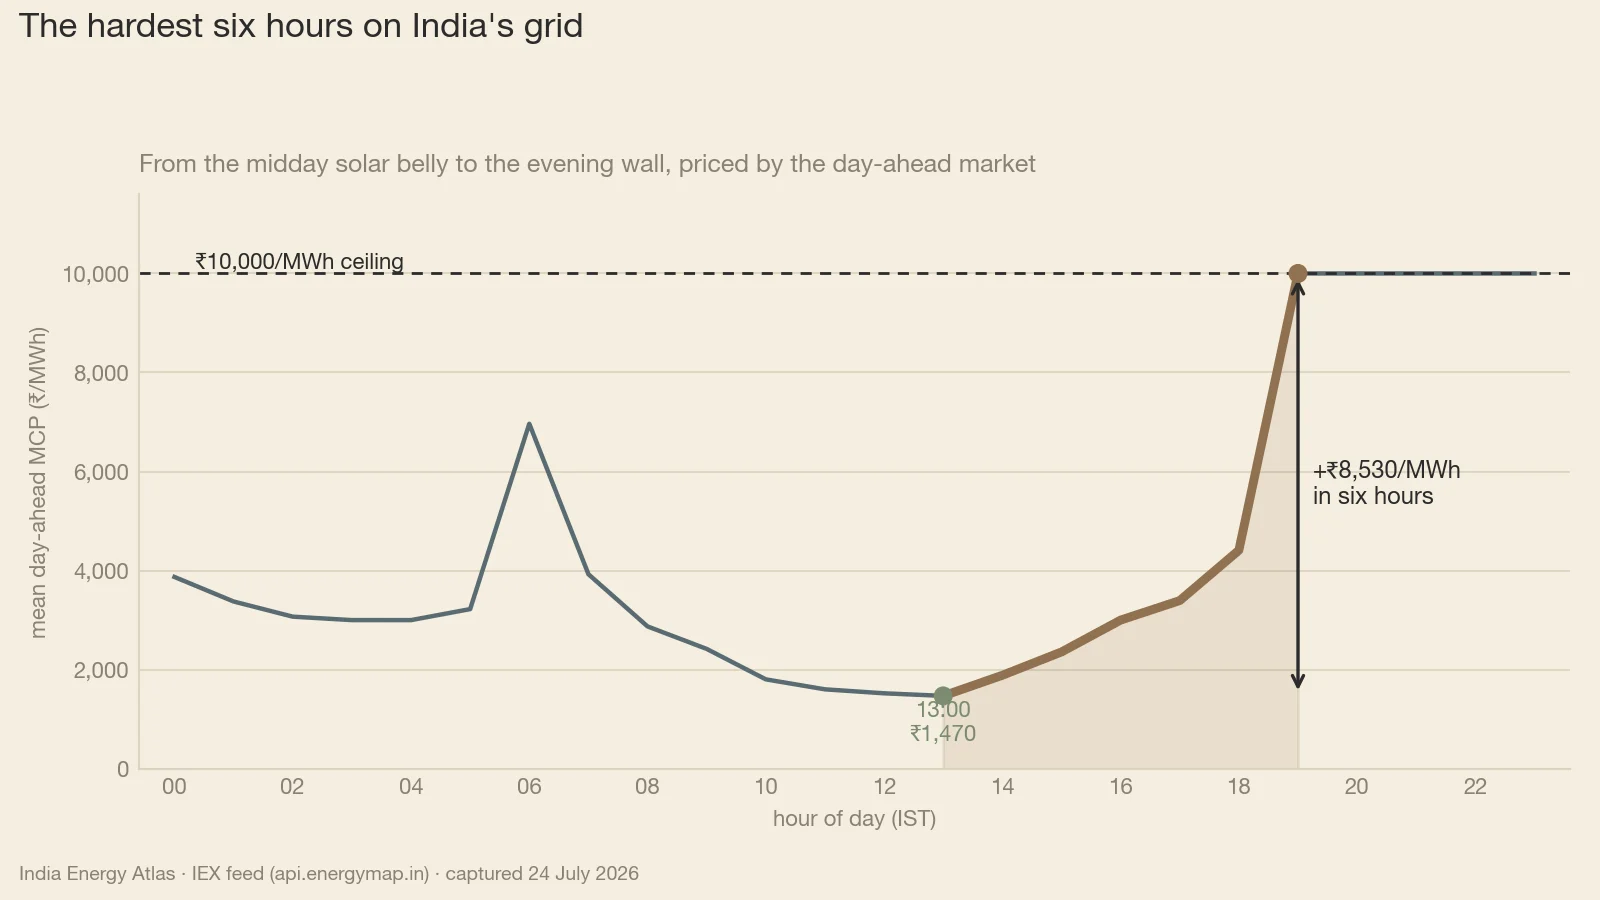
India's day-ahead price climbs roughly sevenfold from the afternoon solar belly to the evening wall, then holds at the ceiling for five straight hours. The binding constraint on the grid is the speed of that transition, and the market prices it brutally.
India's hardest engineering problem carries a timestamp. In the middle of the afternoon the day-ahead market prices power at about a rupee and a half a unit. A few hours later it is rationing the same power at ten rupees, the administered ceiling, and it stays there until late at night. The climb between those two states is roughly sevenfold, and the system has to cover it in about the time it takes the sun to go down.
The three features of the Indian price day #
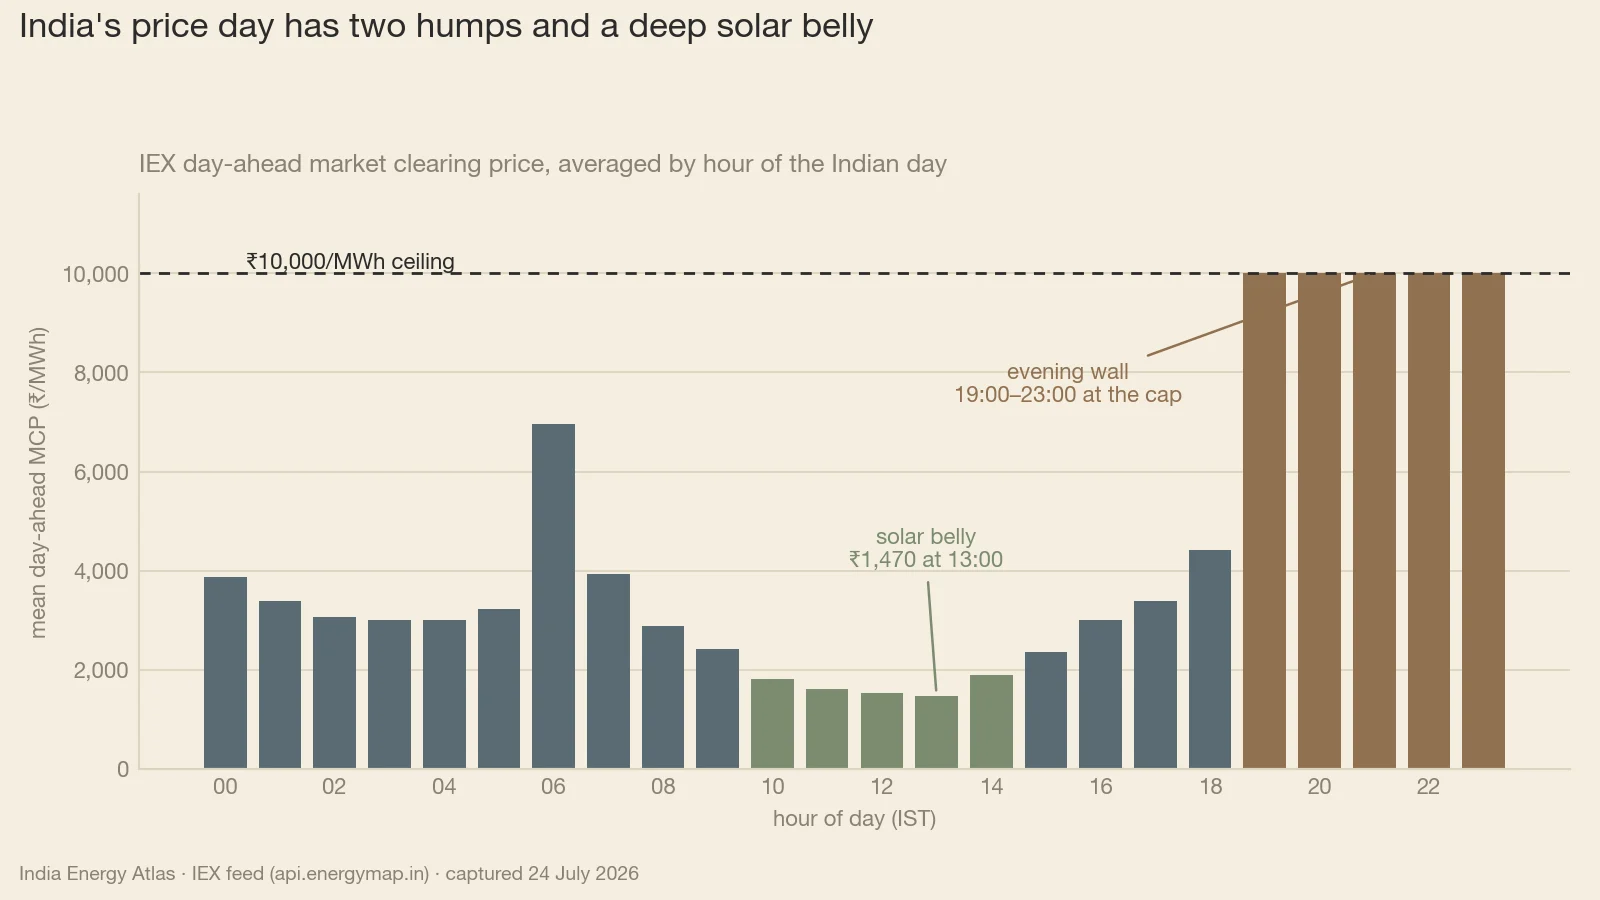
Average the day-ahead clearing price by hour of the Indian day — the /duck-curve view on the Atlas, captured this July — and the day resolves into three features.
A morning hump near ₹7,000/MWh, arriving before there is enough sun on the system to matter.
A solar belly through the middle of the day, when the market clears near ₹1,500/MWh.
An evening wall: five consecutive hours pinned to the ₹10,000/MWh ceiling, block after block, from seven in the evening until eleven at night.
Elsewhere this shape gets called a duck; India's second hump makes it closer to a camel. The distance between the belly and the wall is the entire subject here (Fig. 1). As a ratio or as a level, it describes one physical event: a grid carrying tens of gigawatts of solar becomes a grid carrying none, while demand climbs toward its daily maximum. The hourly levels behind all three features are in Fig. 2.
Hourly averages bracket the transition without resolving it. The belly runs into mid-afternoon; by seven the wall is already complete. Everything difficult sits in between, and the sharpest part of it occupies the last three hours, once photovoltaic output falls away in earnest and the evening load lands on top of the gap.
What the price is standing in for #
A price curve is a despatch record written in rupees. When the exchange prints a rupee and a half at one in the afternoon and ten rupees at seven, it is reporting that the marginal megawatt-hour of the evening comes from a far more expensive place in the merit order, and that at the margin there was not enough of it to go round.
Be precise about what that establishes. The megawatt-per-minute ramp rate India's fleet actually delivers across the sunset window is a despatch-telemetry measurement, taken unit by unit at the load despatch centres, and no figure for it is claimed here. The price curve is a proxy for the net-load ramp — accurate enough to size the commercial problem, silent on the engineering one. The two move together because the plant that can follow a steep net-load rise is the same plant that sets the evening clearing price.
What has to happen between sunset and nine o'clock #
Three things happen at once, and they compound.
Solar output decays to nothing. Utility-scale plant in Rajasthan, Gujarat and Karnataka — the states that dig the deepest midday belly — produces its last useful megawatt-hours in the late afternoon and then stops, on a schedule set by the sun and modified only by cloud.
Urban cooling load persists past sunset. Building thermal mass keeps air-conditioning running after ambient temperature starts falling, so the cooling block does not switch off when the solar block does.
Lighting and evening commercial-plus-residential load overlap. Offices, retail and street lighting arrive on the system while households return to it. In demand centres like Maharashtra and Delhi, the two land inside the same two-hour band.
Net load — demand minus non-despatchable renewable output — therefore rises by the sum of the demand increase and the solar decrease. Everything left has to be ramped, and it has to be ramped by plant that answers to instruction. Each year of new solar deepens the belly without touching the evening, so the transition has to be covered faster than it was the year before.
The scale of what that plant holds up is considerable. India's all-time peak arrived in May. At a shade over 270 GW it beat a record set only weeks earlier, and renewables including hydro met about a third of that hour. Roughly two-thirds of the hardest hour of the Indian year came from despatchable plant, and the true share is higher still, because hydro sits inside the renewable count and follows instruction like any thermal unit.
The exchange has already put a price on speed. It prints that price at the same hour every evening, and it is the widest gap in the Indian power day.
Where the flexibility premium is paid #
The ramp is priced twice: once a day ahead, once in real time. The two prints differ, and the difference is the premium buyers pay for certainty about the evening.
On the July delivery day sampled here, the day-ahead market cleared dearer than real time in all 96 blocks, by about half again on average. Buyers who committed a day in advance paid up for the guarantee of cover through the ramp. Buyers who could hold a position to within an hour of delivery cleared cheaper. Across the wider sample of that week the same direction holds, more mildly.
One day is one day, and the sign of that spread flips with weather, forecast error and how tight the system reads on the morning of delivery. The shape underneath it survives every sample we hold. More than a third of day-ahead blocks in the sampled week cleared at the ceiling, and across the trailing year the cap bound roughly one hour in seven (Fig. 2). In every summer month from April to July the upper-quartile block sat at the cap: the top quarter of summer hours is scarcity-priced, and almost all of that quarter lives inside the evening wall.
Five things that can fill a three-hour ramp #
Coal carries the block today, and will for years. Its constraint is the operating range of each unit and the speed at which that range can be traversed — plant-specific, degraded by part-load heat rate and by the cost of two-shifting an asset built for baseload. Coal-heavy systems such as West Bengal and Chhattisgarh hold that duty tonight.
Hydro is the fastest conventional answer India already owns, and it is counted inside the renewable share of the record peak. Water limits it: reservoir level, season and irrigation obligations decide how much is available on any evening.
Gas moves quickly and is priced by fuel. A gas unit bidding into the evening block competes against a capped price, so the ceiling caps its recovery as well.
Demand response is the cheapest megawatt in the window, because it is the one nobody consumes at eight in the evening. Its cost is contracting, metering and settlement. Its value benchmark is the full belly-to-wall spread.
Storage monetises that shape directly. Modelled against the realised prices of one July delivery day, a 100 MW four-hour battery charging through the belly and discharging into the wall captures almost the whole spread — roughly ₹34 lakh of gross energy margin in a day. The modelled two-hour asset earns about half as much, even though its unit spread is marginally wider, because the binding variable in this problem is duration. The ramp lasts hours, so the asset has to last hours.
Two honesty caveats travel with that number. It is one favourable summer day, and the ceiling clears only about a seventh of the year, so naive annualisation overstates badly. And it is a gross energy margin before round-trip losses, degradation, charges and capital cost.
The pipeline is moving toward this. India's installed grid battery fleet stands near 8.5 GWh after an eleven-fold year, with a comparable volume commissioning this year and hundreds of gigawatt-hours tendered behind it. Against that, the CEA projects a national requirement of 236.2 GWh by the early 2030s. The gap between those two figures is the evening problem, stated in gigawatt-hours.
So what — who should act #
For the DISCOM and system planner. Procure by shape. A portfolio priced off the ₹4,101/MWh trailing-year average will not survive an unhedged position concentrated in the hours when the market prints ₹10,000. Before the next tender, decompose the last twelve months of your own purchase into the hourly profile on /duck-curve, and check where your state's peak actually lands on its state page. The evening block is the one worth hedging, contracting and, where possible, flattening.
For the IPP and storage developer. Bid duration, and site for the belly. The modelled four-hour asset earned about twice what the two-hour asset earned, even though the shorter asset caught a marginally wider unit spread: the ramp does not end when the first two hours do. Charge where midday clearing is deepest — Rajasthan and Karnataka — and build the case on the full price-duration record, where the cap binds about a seventh of the year, since a single July print overstates it.
For the regulator. The ceiling holds the number down while the ramp underneath keeps steepening. Five straight hours at the administered cap, in every summer month with an upper quartile at that cap, is a market reporting that the product it is short of is speed and duration in the evening. The instruments that answer that are flexibility and ancillary products, firm demand-response contracts with real settlement, and storage procurement written against the evening block — each of which needs a price signal the cap currently truncates.
For the trader and analyst. Track the day-ahead-minus-real-time spread block by block through the late afternoon as a live read on how the system expects the ramp to go. On the day sampled here the day-ahead price ran about half again above real time in every block; the days that sign flips are the days the ramp is genuinely tight. Pair it with the count of capped blocks per evening, and watch both against the hourly shape on /iex-market.
The evening wall arrives every single day, on schedule, at the same hour, in fair weather and foul. The market has already told everyone what clearing it is worth.
Sources & method
Prices are IEX market clearing prices (MCP) in ₹/MWh, read from the India Energy Atlas market feed (api.energymap.in — day-ahead, real-time, duck-curve, price-duration and storage-arbitrage views) and captured 24 July 2026. The hourly profile averages day-ahead MCP by IST hour; feed timestamps are UTC and are converted to IST (UTC+5:30). ₹1,000/MWh = ₹1/kWh = ₹1 per unit, and ₹10,000/MWh is the administered ceiling. Day-ahead share-at-cap figures cover 400 fifteen-minute blocks across the 20–24 July 2026 delivery days; annual shares cover 44,733 fifteen-minute blocks over the trailing 365 days and are reported as percentages of observed blocks, never converted to absolute hours, because the block set spans multiple price areas. The day-ahead versus real-time comparison uses the 96 blocks of the 23–24 July 2026 delivery day. Storage figures are modelled dispatch against that day's realised price series and are gross energy margins before round-trip losses, degradation, charges and capital cost; one favourable summer day is not an annual return. Peak demand figures are from the Atlas national feed (tracked national peak 269.4 GW; live demand 213.4 GW at the 00:15 IST slot on the capture day) and, where cited, from PIB and Down To Earth; battery pipeline and CEA requirement figures are from published trade reporting (Saur Energy, Power Peak Digest). The trailing-year mean of ₹4,101/MWh and the ₹1,470–₹1,602/MWh midday band are from the same Atlas feeds. The article treats the price curve as a proxy for the net-load ramp; the megawatt-per-minute ramp rate of the Indian fleet is a separate despatch-telemetry measurement and no value for it is claimed here.