
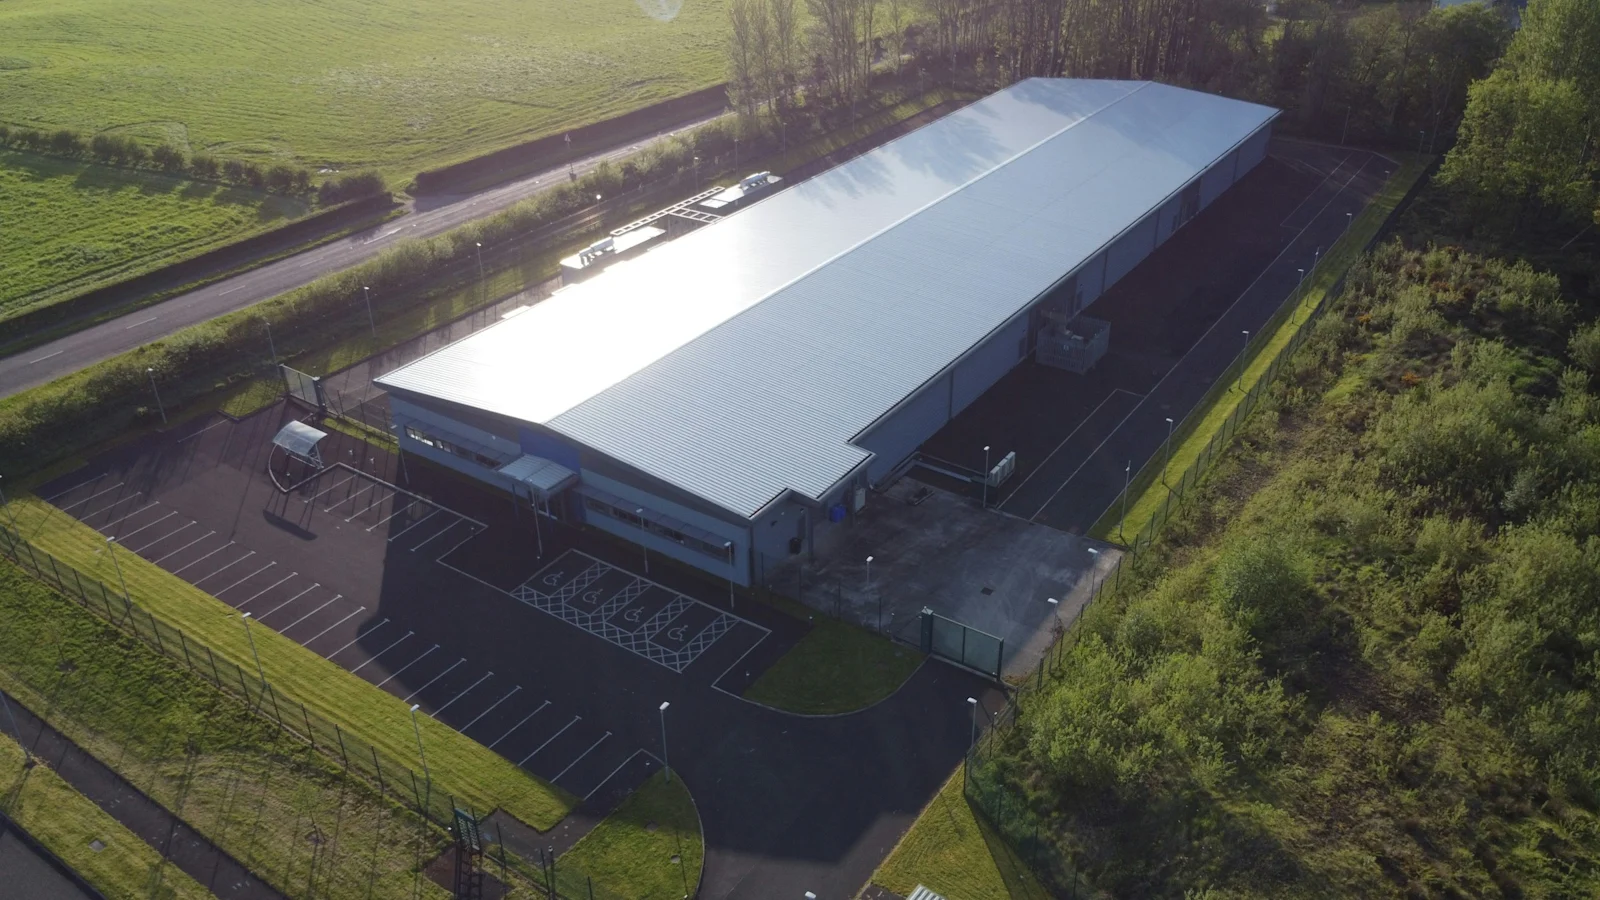
The Indian Data Centre Playbook
Twelve-part technical and commercial playbook for Indian data centres — unit economics, siting, grid interconnection, electrical and cooling design, power procurement, carbon, operations, flexibility, monetization and exit.
Every generic data centre guide explains what a Tier III facility is. None explain why a 100 MW campus in Navi Mumbai takes thirty-four months to energise while the building shell takes fourteen, or how the landed cost gap between open access and DISCOM supply moves project IRR by three hundred basis points.
India's operational colocation stock reached 1,819 MW of IT load in H1 2026, up 36.6% year on year, with 258 MW added in six months and 278 MW absorbed — over 80% of it by hyperscalers (Savills India, July 2026). The binding constraint has moved from demand to power: procurement, interconnection, and the regulatory path between them.
This is written for the person who has to sign the capex note.
The series is the working companion to the India Data Centre Review 2026 — India Energy Atlas's annual assessment of the sector's capacity, capital, power, water, connectivity, policy and disclosure position. The Review establishes the market position; the Playbook builds the models a developer, lender or planner has to construct on top of it. IDCR figures quoted across the twelve posts are taken at the locked edition snapshot of 13 July 2026.
The twelve #
1. The Unit Economics of an Indian Data Centre ₹55–70 crore per MW to build, ₹7,000–10,500 per kW per month to earn, 15.5% yield on cost at stabilisation. The ramp, not the rent, decides the IRR.
2. Site Selection Is a Power Problem Screen substation headroom before land title. A 100 MW facility needs 159 MVA firm. Plus the timezone criterion nobody runs.
3. Securing the Connection Twenty-six to thirty-four months at EHV. Right-of-way and long-lead transformers carry the schedule risk. Decide the supply structure before you apply.
4. Designing the Electrical Topology 2N costs ₹12 crore per MW more than N+1. The SLA payback calculation fails; the tenant addressability calculation inverts it.
5. Cooling in an Indian Climate The same design delivers 1.28 in Bengaluru and 1.42 in Chennai. A 20 MW facility draws 735 cubic metres of water a day.
6. Backup Power Economics Batteries cannot replace diesel at four hours. They can replace the UPS string at thirty minutes. And data centre generators sit outside the CPCB IV+ regime entirely.
7. Powering the Build A ₹2.50 PPA arrives at the meter around ₹5.50. Group captive is worth ₹44 crore a year on a 20 MW block.
8. Carbon, RPO, and the 24/7 Question 428,000 tonnes a year from one 60 MW facility. Hourly matching is convex: the last seven points cost more than the first sixty.
9. Operating the Facility Recovering 0.14 of PUE is worth ₹16 crore a year. Under a pass-through lease the tenant captures all of it.
10. The Data Centre as a Grid Asset India dispatched 29 GW of down-regulation in one fifteen-minute block. The grid is not asking you to use less at 8 pm. It is asking you to use more at noon.
11. Monetization Architecture One megawatt holds 1,136 GPUs. As colocation it earns ₹10.8 crore. As GPU-as-a-service, ₹151 crore — against ₹341 crore of silicon that depreciates in three years.
12. Capital Stack and Exit Build at 15.5%, exit at 10%. The ₹678 crore between them is the business.
The measurement layer #
The series draws on the first open, high-resolution measurements of GenAI workload power — 0.1-second traces from NVIDIA H100 nodes, scaled to whole-facility profiles (Vercellino et al., arXiv:2604.07345, April 2026). Our India-centric reading of that dataset produced four findings that revised five posts in this series:
Facility power peaks at 73–80% of rated design even at full node utilisation, which means Indian developers are contracting sanctioned demand they will never draw
Training jobs already queue an average of 2.58 hours at 60% utilisation, which converts the flexibility argument from assertion to evidence
Measured load carries a coefficient of variation near 45%, creating deviation settlement exposure that no Indian data centre model prices
The customer's timezone determines whether a facility peaks with or against the Indian evening peak
How to use this #
If you are | Read |
A developer scoping a new campus | 1, 2, 3, 4 |
An infrastructure investor underwriting | 1, 7, 11, 12 |
A DISCOM or SLDC planner | 2, 3, 10 |
An energy manager structuring procurement | 7, 8, 10 |
A hyperscaler sourcing lead | 5, 8, 9, 11 |
Working on policy or regulation | 3, 6, 8, 10, 12 |
Every quantitative figure carries a named source with vintage. Modelled figures are separated from sourced figures and labelled as model assumptions throughout. Where credible sources disagree — as they do on India's installed capacity, and on IndiaAI GPU pricing — both are shown with the reason for the gap rather than reconciled silently.
India Energy Atlas builds India's grid intelligence layer — substation headroom, interconnection queues, market prices and carbon intensity in one place. See energymap.in/pricing.
Sources & method
Every quantitative figure carries a named source with vintage. Modelled figures are labelled as model assumptions throughout and are not attributed to any external source. India Data Centre Review 2026 figures are quoted at the locked edition snapshot of 13 July 2026.