
Global Benchmarking: India vs. Four Comparators
How India's cost structure, policy environment, and infrastructure readiness compare against Singapore, Malaysia, Indonesia, and the UAE across twelve dimensions.
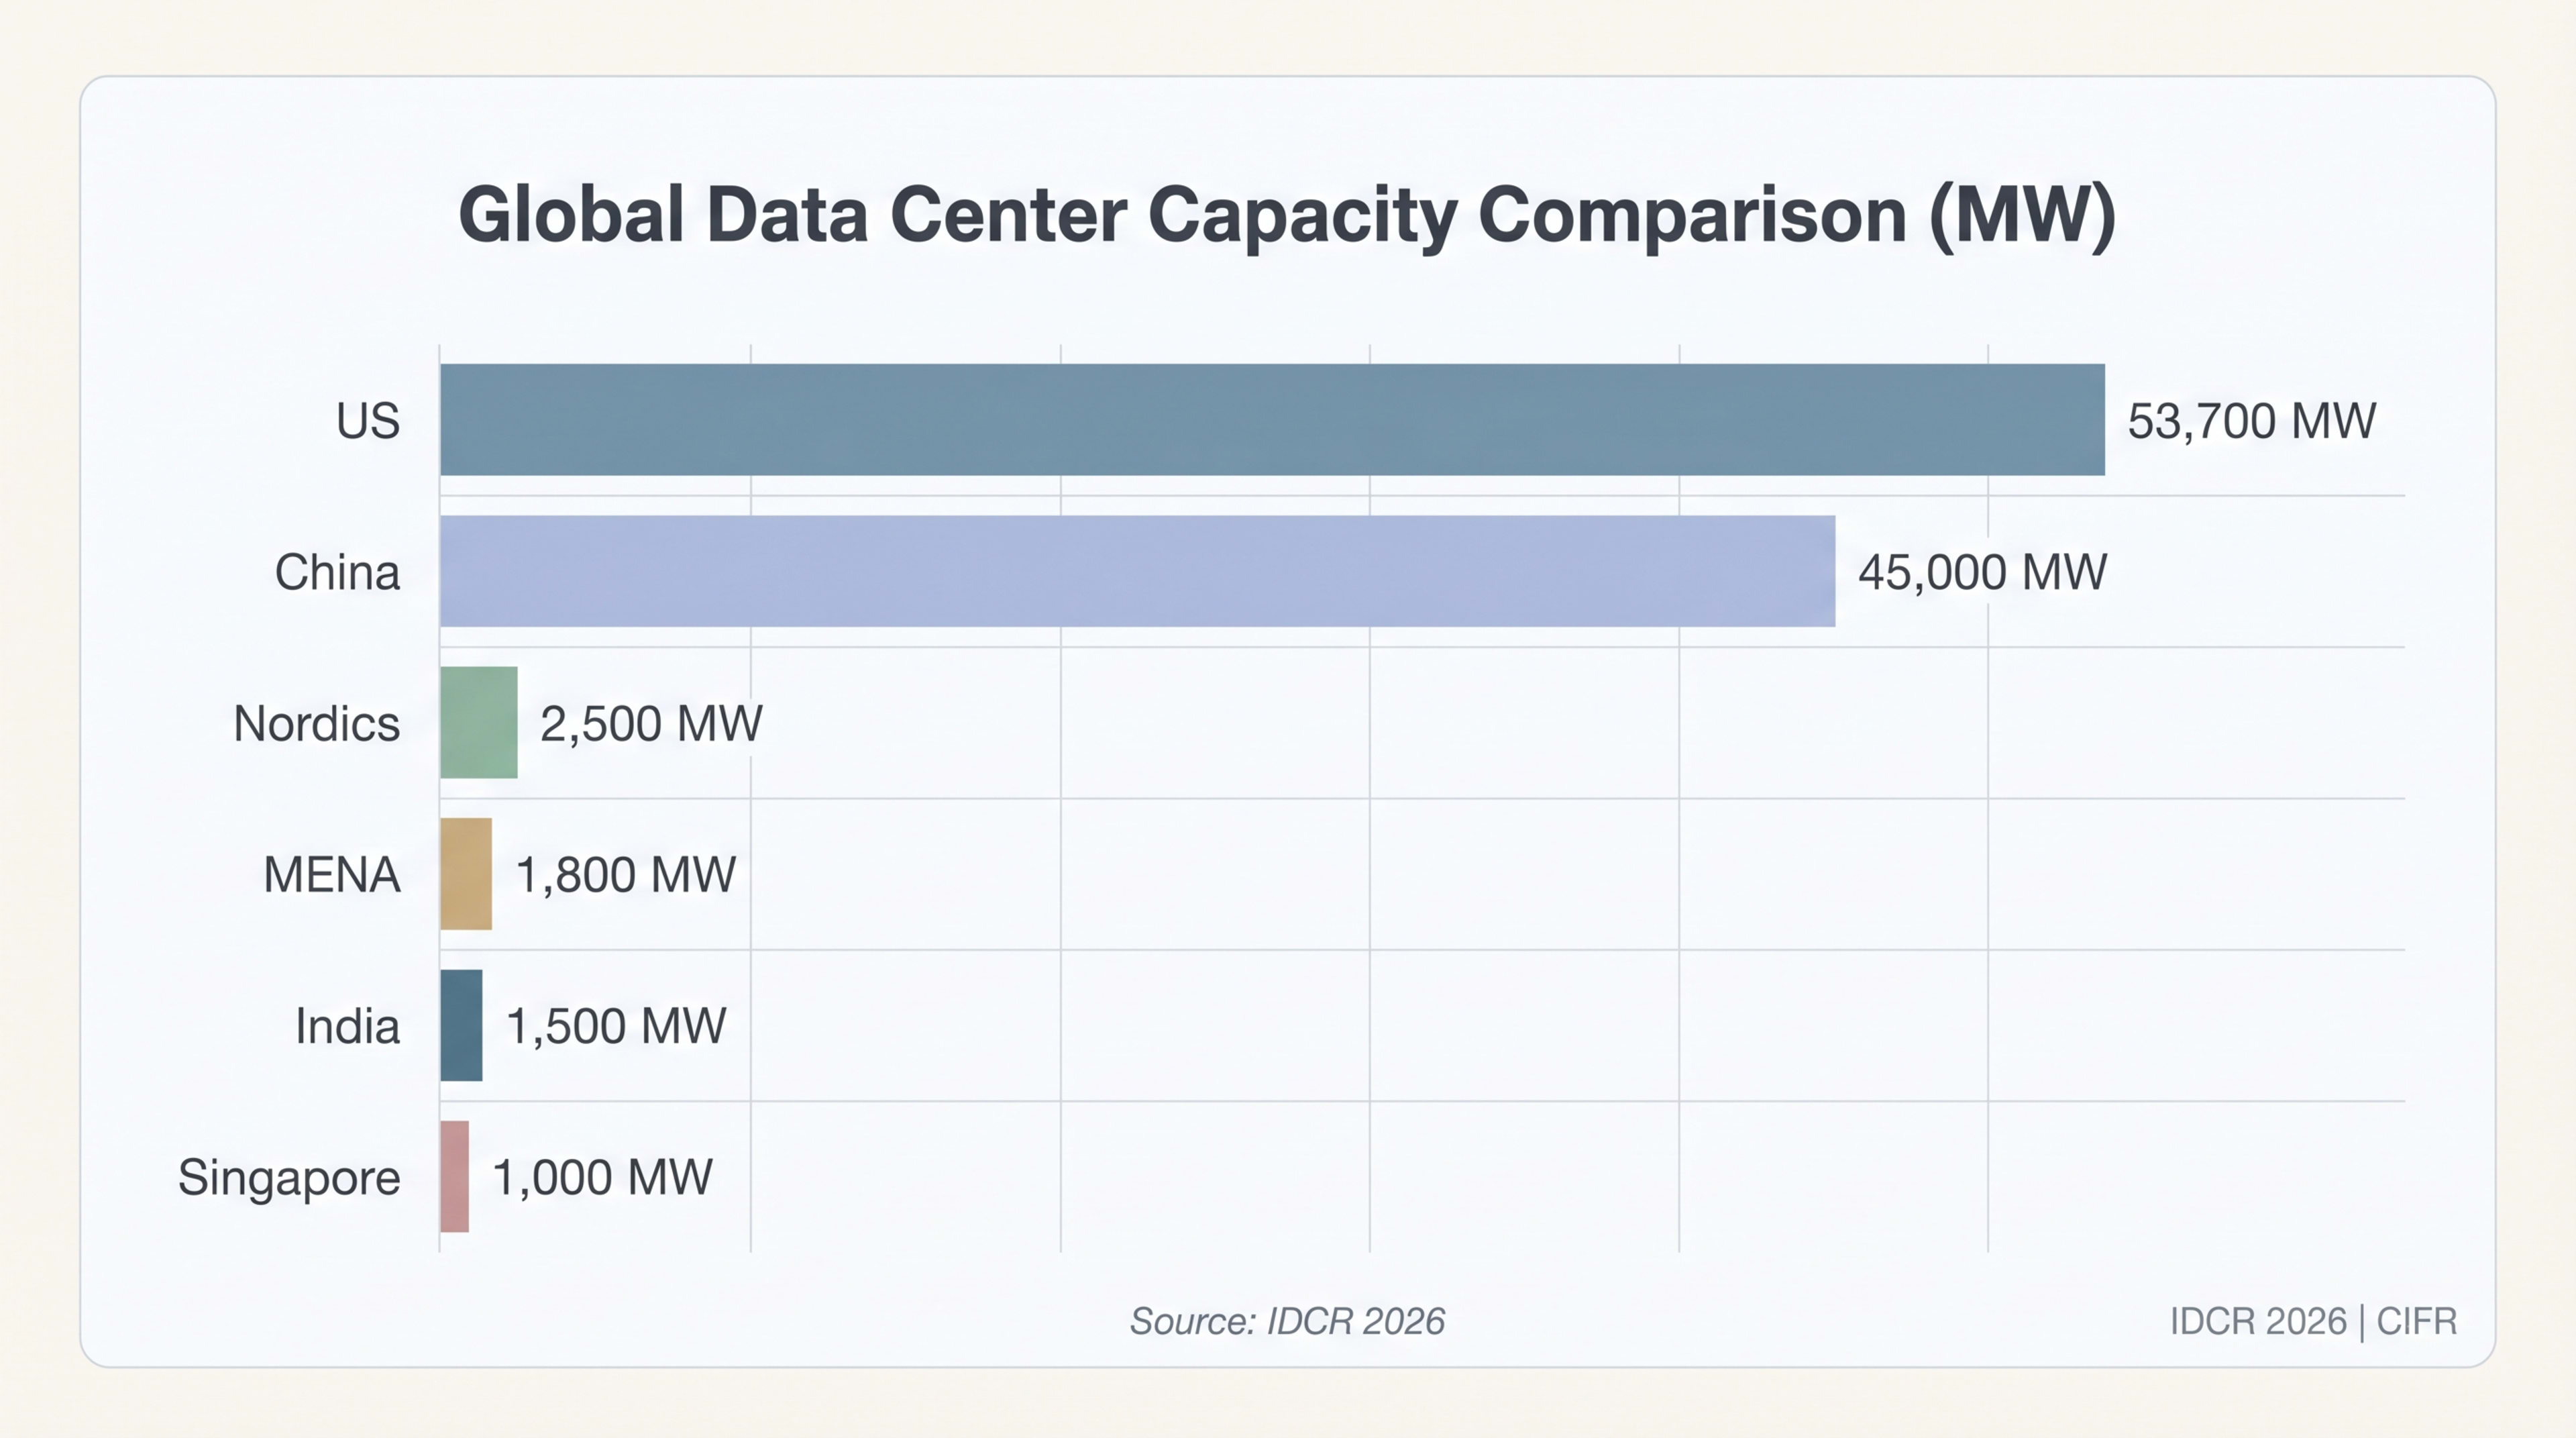
India leads on construction cost, cap rates, and demand growth. It lags on grid reliability, PUE, and sustainability disclosure. This chapter benchmarks India against the United States, Singapore, the Nordics, and MENA across twelve dimensions.
India construction cost
lowest of any major DC market
Singapore per-watt build
highest in the comparator set
India cap rate
highest in APAC
Mumbai electricity
¢/kWh; vs Singapore ~20 ¢
Cross-comparison atlas pages: /compare · /pricing · /carbon-intensity. Live carbon intensity context: 906 gCO₂/kWhlive · 03 Oct 2026, 01:30 IST.
India's Construction Cost Advantage Is the Widest in Any Major DC Market
India's construction cost ranges from $5--7M/MW (conventional) to $7--9M/MW (AI-ready facilities), the lowest globally (Turner & Townsend DCCI 2025). For standard colocation, India costs approximately $4--5 per watt versus $15.2 in Tokyo, $14.5 in Singapore, $12.4 in Oslo, and $8--12 in the United States.
Three factors drive this advantage: labour costs at 20--30% of US equivalents; domestic materials availability (steel, concrete, cable); maturing local EPC firms. Specialised components---high-density UPS systems, precision cooling, GPU-rated power distribution---remain imported, introducing forex and lead-time risk.
A 100 MW campus costs $550--850M in India versus $1.2--1.5B in Singapore and $800M--$1.2B in the US. At comparable rents, India assets yield higher IRRs, attracting global infrastructure funds.
Twelve-Dimension Benchmarking Matrix: India vs. US, Singapore, Nordics, MENA
| Dimension | India | United States | Singapore | Nordics | MENA |
|---|---|---|---|---|---|
| 1. Installed capacity | 1,520 MW (JLL FY2025) | 53,700 MW | 1,000 MW | 2,500 MW | 1,800 MW |
| 2. Growth rate (CAGR) | 25–30% | 15–20% | 3–5% | 8–12% | 20–25% |
| 3. Construction cost/MW ($M) | 5–7 (conv); 7–9 (AI) | 8–12 | 14–15 | 10–14 | 9–12 |
| 4. Power cost (¢/kWh) | 6.71 | 12–16 | 20 | 5–10 | 8–14 |
| 5. Grid reliability | Variable | High | Very high | Very high | Moderate–high |
| 6. Average PUE | 1.3–1.6 | 1.1–1.3 | 1.3 (mandate) | 1.05–1.10 | 1.3–1.5 |
| 7. RE penetration (%) | 20–40% | 40–60% | 50% (CFA2 mandate) | 80–100% | 10–25% |
| 8. Water stress | High–Extreme | Low–Moderate | High | Low | Extreme |
| 9. Policy environment | Improving | Mature | Highly regulated | Supportive | Aggressive incentives |
| 10. Connectivity (submarine) | 17 cables, 309 Tbps | Extensive | Hub (400+ Tbps) | Moderate | Growing (2Africa) |
| 11. Talent availability | Deep (software) | Deep (all layers) | Constrained | Moderate | Developing |
| 12. Investment returns (cap rate) | 7.5–8.5% | 4.5–5.5% | 5–6% | 5–6.5% | 6–7.5% |
Source: Turner & Townsend DCCI 2025; Houlihan Lokey Dec 2025; S&P Global; Uptime Institute 2025; Council for Independent Frontier Research (CIFR) compilation
India ranks first on construction cost, growth rate, and investment returns---critical for capital allocators. It ranks last on water stress, PUE, and sustainability disclosure---critical for ESG-mandated investors. Closing this gap is essential to access green infrastructure capital.
Singapore's Controlled Scarcity Model Is Driving Demand to India and Malaysia
Singapore maintained a moratorium on new data centre construction from 2019 to 2022, creating scarcity. The Data Centre Call for Application (DC-CFA2, December 2025) allocates 200 MW with strict requirements: PUE of 1.3 or better and 50%+ renewable energy (biomethane, low-carbon ammonia, hydrogen, fuel cells, or on-site solar).
This policy displaces demand to adjacent markets: Johor, Malaysia, and Chennai/Mumbai, India. Johor holds 3,530 MW planned through 2029 and 5.7 GW pipeline---exceeding Singapore's total installed capacity.
Johor has 500 MW operational (2024), with 30% of applications rejected for missing sustainability targets (Data Centre Development Coordination Committee, June 2024). New approvals now favour efficient designs over high-water-use Tier 1/Tier 2 facilities.
For India, this creates opportunity. Chennai's submarine cable connectivity rivals Singapore's for Southeast Asian routes, and its construction costs are 65% lower. India's critical gap: grid reliability. Singapore operators demand 99.999% uptime; India's variable grid does not yet deliver this consistently.
The US Remains the Dominant Market but Faces Its Own Power Crisis
The United States operates 53.7 GW installed capacity---35x India's base. Northern Virginia alone exceeds India's entire market. Yet the US faces acute power constraints and long grid queues. Oregon and Texas have moved beyond general concern to enacted large-load frameworks that address cost allocation, interconnection or emergency response; Virginia's 2026 cost-allocation language remained proposed at this cutoff.
Keep reading — free, takes 30 seconds
Global Benchmarking: India vs. Four Comparators continues with 1,200 words and 18 figures.