Renewable Energy Procurement
RE procurement pathways, the hourly-match math behind operator sustainability claims, and the carbon intensity data that separates credible 24/7 commitments from annualised accounting.
How India's data centres navigate renewable energy procurement, carbon accounting, and net-zero pathways in a coal-dominant grid.
Live carbon context: national grid intensity · IEX day-ahead . Atlas pages: /renewables · /carbon-intensity · /carbon-markets · IEX green market · PPA reviewer tool · methodology blog.
India's Grid Emission Factor: The Carbon Baseline
India's electricity grid is among the most carbon-intensive globally. The Central Electricity Authority's CO₂ Baseline Database Version 21.0 (December 2025) reports a weighted average grid emission factor of 0.710 tCO₂/MWh (FY2024-25), declining from 0.757 tCO₂/MWh (CEA v20.0, FY2023-24)---based on generation data through FY 2023--24.
- EU grid: 0.23 tCO₂/MWh
- US grid: 0.39 tCO₂/MWh
- Singapore: 0.41 tCO₂/MWh
- India: 0.710 tCO₂/MWh
For a 50 MW data centre operating at 85% utilisation (372,300 MWh/year), unabated grid consumption translates to approximately 281,830 tonnes of CO₂ annually---equivalent to the emissions of ~60,000 passenger vehicles. This carbon burden is the central challenge for India's data centre industry as it confronts growing ESG expectations from hyperscaler tenants, institutional investors, and international climate frameworks.
Grid decarbonisation has occurred gradually. Emission factors declined from 0.82 tCO₂/MWh (FY 2018--19) to 0.757 (FY 2023--24, CEA v20.0) to 0.710 (FY 2024--25, CEA v21.0), reflecting renewable capacity additions. Yet the pace of decarbonisation (approximately 1.5% per year) is insufficient for data centres targeting 2030 net-zero commitments.
Operators must pursue active renewable procurement. Passive reliance on grid greening will not achieve 2030 targets.
Source: CEA CO₂ Baseline Database v21.0, December 2025; CEA v20.0, December 2024; UCR Grid Emission Factor 2025 Vintage
| Market | Grid EF (tCO₂/MWh) | Coal Share (%) | RE Share (%) | Annual CO₂ / 50 MW DC |
|---|---|---|---|---|
| India | 0.710 | 74% | 12% | 282,000 t |
| Singapore | 0.408 | 0% | 3% | 152,000 t |
| United States | 0.390 | 16% | 22% | 145,000 t |
| European Union | 0.230 | 12% | 44% | 86,000 t |
| Nordics (Swe/Nor) | 0.020 | 0% | 98% | 7,400 t |
Source: CEA v21.0 Dec 2025; CEA v20.0 Dec 2024; EMA Singapore 2024; US EPA eGRID 2023; EEA 2024
RE Procurement Pathways for Data Centres
Indian data centre operators access four primary renewable energy procurement pathways. Each pathway carries distinct economics, regulatory complexity, and scalability constraints. Pathway selection depends on facility size, operational state, DISCOM policies, and whether the operator prioritises cost savings, carbon reduction, or additionality.
| Pathway | Structure | Typical Tariff | Landed Cost | Min. Load | Additionality |
|---|---|---|---|---|---|
| Open Access (Third-Party PPA) | PPA with IPP; power wheeled via grid | ₹3.5–4.5/kWh | ₹5.0–7.5/kWh | 1 MW | High |
| Group Captive | 26% equity + 51% offtake in RE SPV | ₹3.0–4.0/kWh | ₹4.0–5.5/kWh | 1 MW | High |
| Captive / Behind-the-Meter | Rooftop solar or onsite wind; self-owned | ₹2.5–3.5/kWh | ₹2.5–3.5/kWh | Any | Medium |
| Green Tariff / DISCOM RE | DISCOM's RE bundle tariff; no wheeling | ₹5.5–7.0/kWh | ₹5.5–7.0/kWh | Any | Low |
| REC / I-REC Purchase | Buy certificates; consume grid power | N/A | ₹0.3–1.0/kWh premium | Any | Low |
Source: Mercom India Q3 2025; CEEW Open Access Calculator; Fourth Partner Energy 2025; Electricity Act 2003 §9
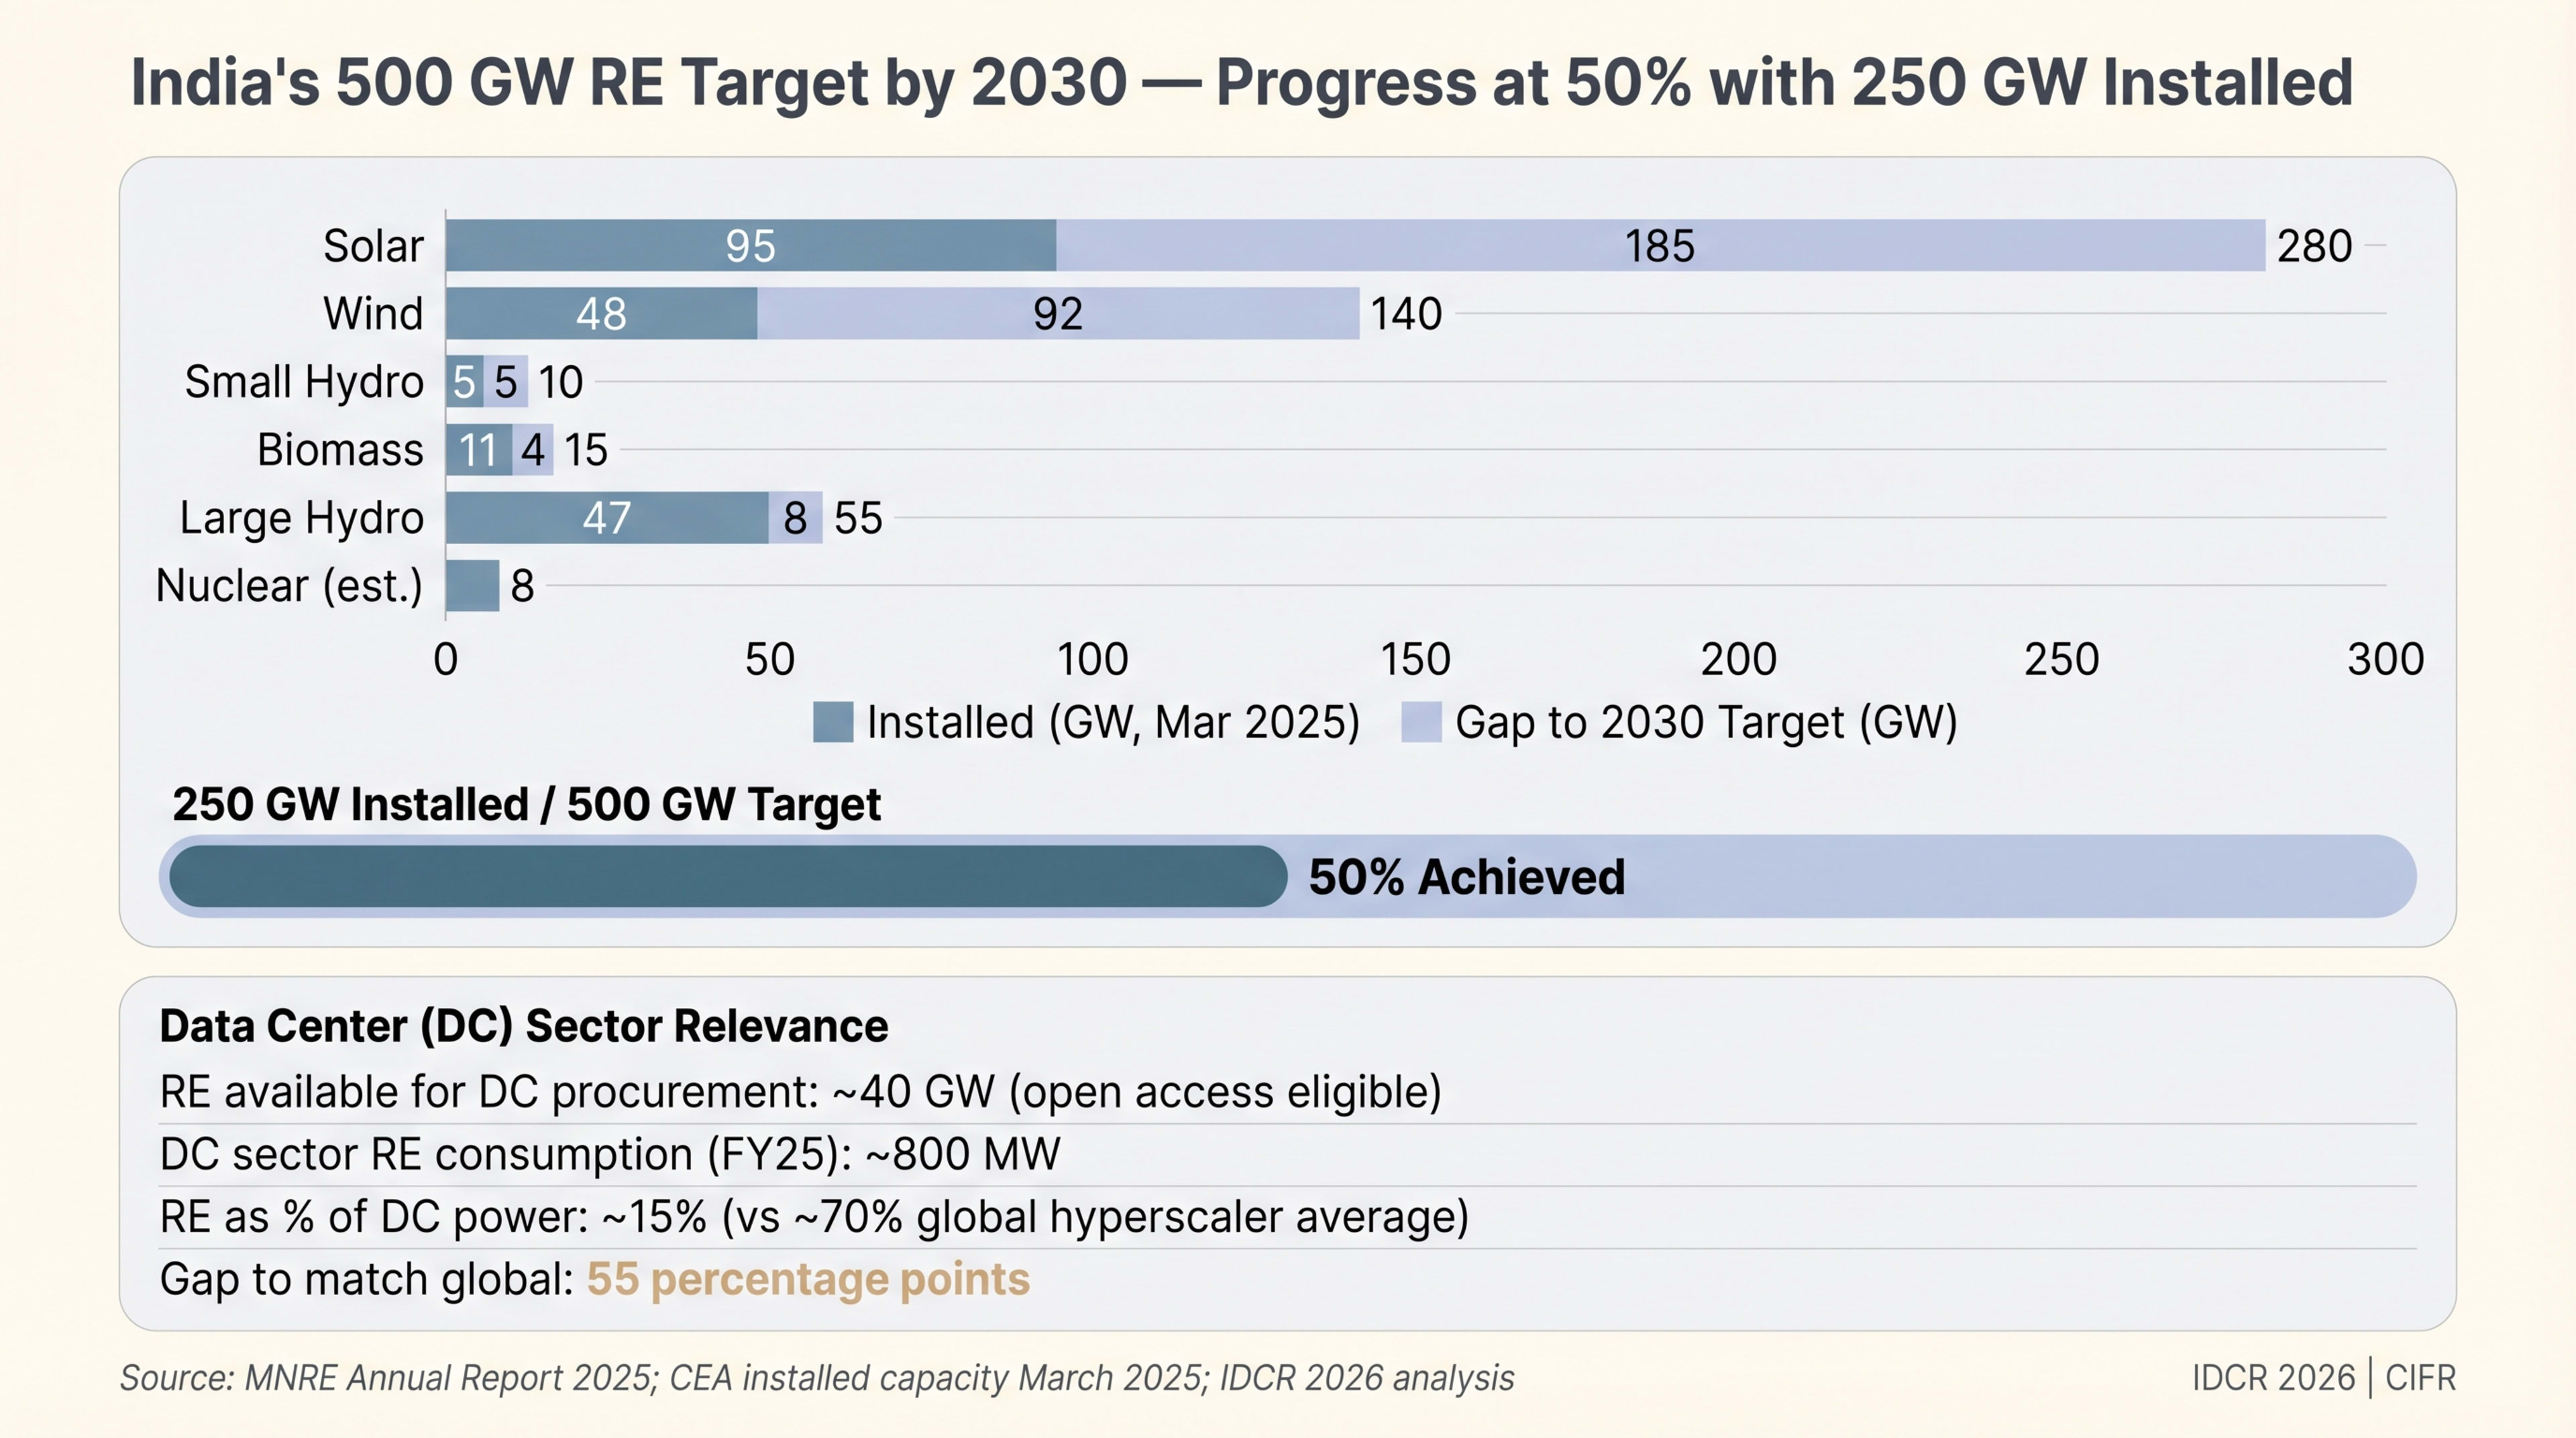
Open access and group captive pathways dominate among large operators. India's solar open access market reached 21.5 GW installed capacity by March 2025, with 1.1 GW added in Q1 CY 2025 alone.
Rising cross-subsidy surcharges (CSS) and additional surcharges across multiple states are eroding cost savings. Maharashtra's new Time-of-Day (ToD) tariffs and 5% energy banking limits have materially reduced open access economics for data centres requiring round-the-clock power. Gujarat's additional surcharge rose 22% to ₹1.0/kWh by Q4 2025. Chhattisgarh's CSS surged 107% at 220 kV. Of 15 states analysed by Mercom, 12 saw landed cost increases in Q4 2025.
Solar PPA tariffs have fallen to ₹3.5--4.5/kWh. Effective landed costs for open access consumers reach ₹5.5--7.5/kWh after wheeling charges, CSS, additional surcharge, and transmission losses. In Gujarat and Maharashtra, system charges now exceed PPA tariffs---a tax on green procurement. Data centre operators must model state-specific landed costs, not headline PPA tariffs.
Open Access RE Economics by State: The Landed Cost Reality
Renewable energy economics differ sharply by state due to wheeling charges, CSS, additional surcharges, and banking policies. Data centres require 24/7 power and cannot shift load to match solar generation. The gap between "PPA tariff" and "landed cost" determines project viability.
| State | Solar PPA (₹/kWh) | CSS (₹/kWh) | Wheeling (₹/kWh) | Add'l Surcharge | Landed Cost | Banking Policy |
|---|---|---|---|---|---|---|
| Maharashtra | 3.8–4.2 | 1.14 | 0.48 | 0.54 | 6.0–6.4 | 5% net; ToD applied |
| Karnataka | 3.5–4.0 | 0.50 | 0.35 | 0.25 | 4.6–5.1 | Permitted with charges |
| Tamil Nadu | 3.6–4.2 | 0.85 | 0.40 | 0.10 | 4.9–5.6 | Add'l surcharge cut 81% |
| Gujarat | 3.5–4.0 | 0.78 | 0.42 | 1.00 | 5.7–6.2 | +22% add'l surcharge Q4 |
| Telangana | 3.4–3.9 | 0.65 | 0.32 | 0.40 | 4.8–5.3 | 12-month banking |
| Uttar Pradesh | 3.8–4.5 | 1.20 | 0.55 | 0.45 | 6.0–6.7 | Limited; HT consumers only |
Source: Mercom India Open Access Tracker Q3–Q4 2025; State ERC tariff orders FY26; CEEW RE Cost Calculator
Karnataka and Telangana offer the most favourable economics for solar open access, with landed costs below ₹5.5/kWh and flexible banking policies. Maharashtra and Uttar Pradesh are the most expensive, with total system charges exceeding PPA tariffs by 50--70%. Gujarat's rising additional surcharge creates headwinds for operators in the Ahmedabad--Gandhinagar corridor.
Keep reading — free, takes 30 seconds
Renewable Energy Procurement continues with 1,962 words and 16 figures.
Free Clerk account. No card. We use it to remember your reading position and unlock subscriber chapters.