Power Infrastructure: The Gating Variable
Electricity is the binding constraint on India's data centre ambitions. Power grid connection timelines, reliability gaps, and tariff structures determine capacity deployment more than capital availability, land, or demand.
Live indicators: national peak demand · grid carbon intensity · day-ahead price .
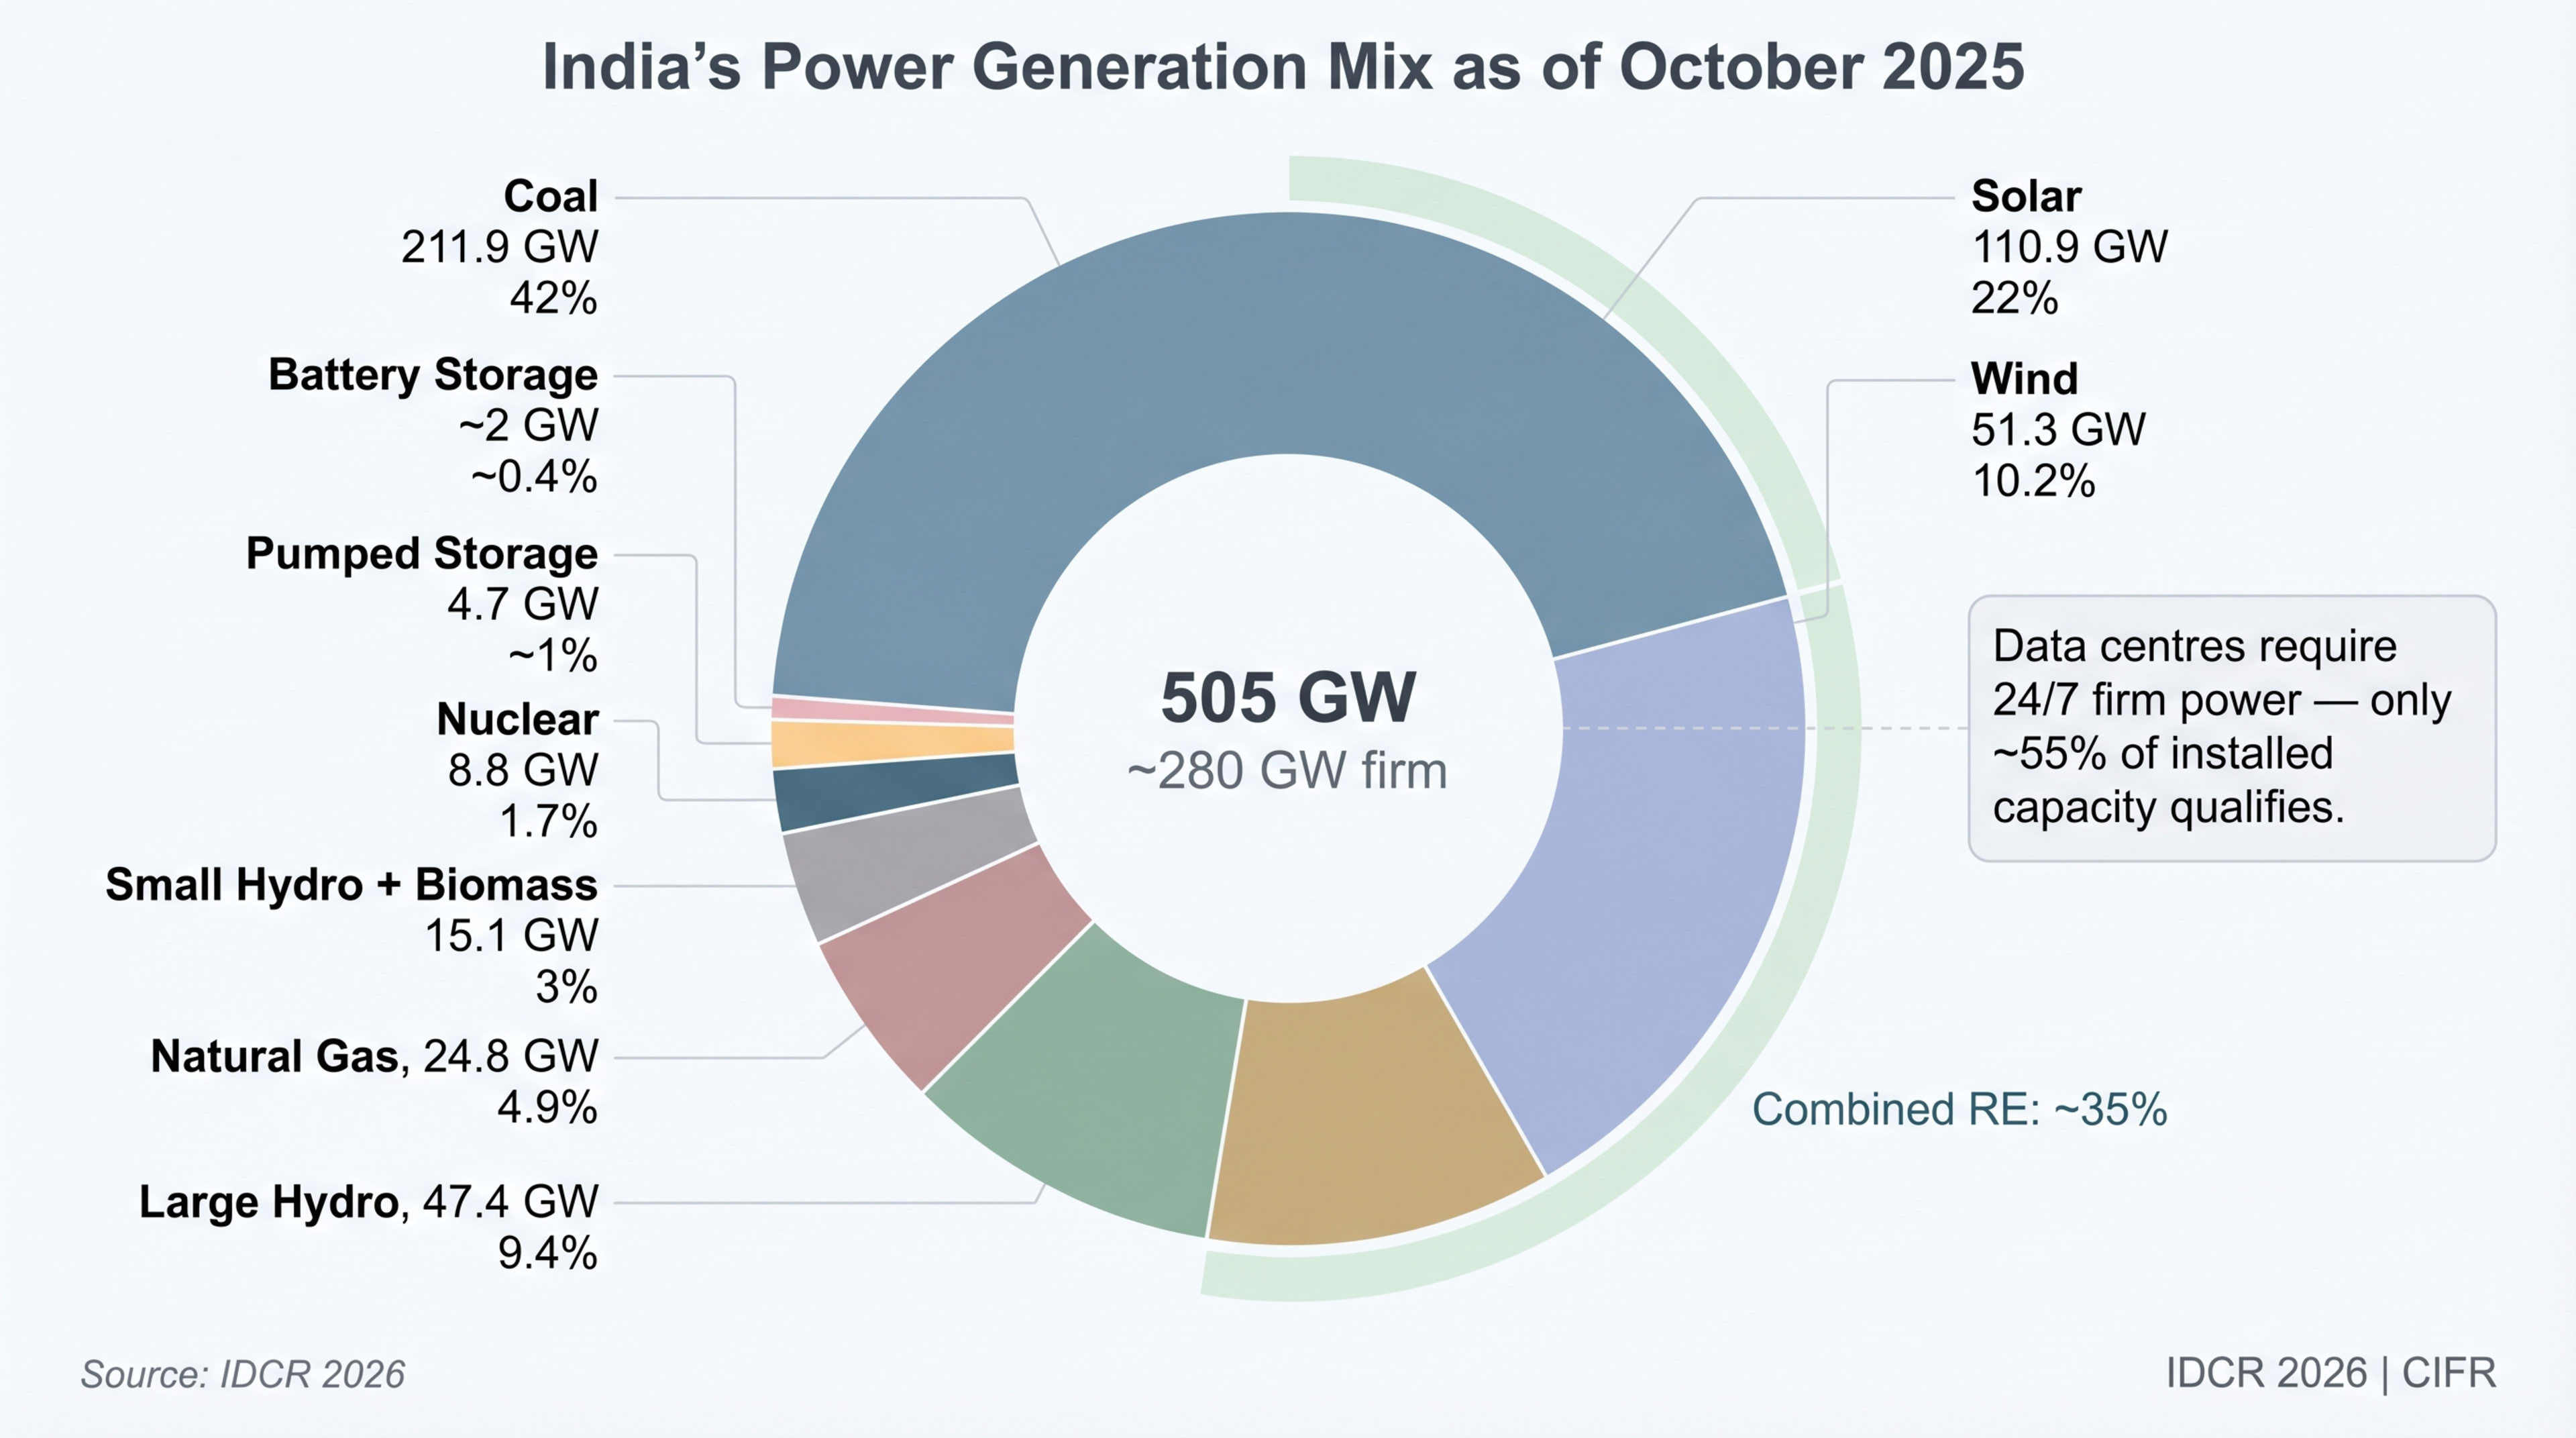
India has 520.5 GW of installed capacity — but data centres need firm, 24/7, high-quality power. India's installed capacity reached 520.5 GW by 31 January 2026 (CEA Installed Capacity Report· CEAJan 2026): coal 227.8 GW, gas 20.1 GW, nuclear 8.8 GW, solar 140.6 GW, wind 54.7 GW, large hydro 51.2 GW, other RE 16.8 GW. Non-fossil sources crossed the 50% threshold in 2025 and now account for over 56% of installed capacity. The live national fuel mix is published on the India Energy Atlas homepage; coal-fleet utilisation is tracked at /coal, the renewables overlay at /renewables, nuclear at /nuclear.
Data centres require firm, 24/7 power at 99.999% (five-nines) reliability — about 5.26 minutes of permitted downtime per year. India's grid delivers 99.7-99.9% reliability across most states. The gap is bridged by diesel generators with 48-72 hours of on-site fuel; this chapter traces why the constraint is power, not capital, and what it takes to unlock the next 7.6 GW.
| Source | Installed Capacity (GW) | Share | Relevance to DCs | Status |
|---|---|---|---|---|
| Coal (thermal) | 227.8 | 43.8% | Primary baseload; ~0.82 tCO₂/MWh | ⚠ Carbon-intensive |
| Natural gas | 20.1 | 3.9% | Potential DC backup (Ch. 6); ~25% PLF | Emerging |
| Solar | 140.6 | 27.0% | Intermittent; needs storage/hybrid | Growing |
| Wind | 54.7 | 10.5% | Intermittent; southern/western concentration | Regional |
| Large hydro | 51.2 | 9.8% | Seasonal; balancing role | Stable |
| Other RE (small hydro, biomass) | 16.8 | 3.2% | Marginal DC relevance | Minor |
| Nuclear | 8.8 | 1.7% | Firm; geographically constrained | Stable |
| Pumped storage | 4.7 | 0.9% | 18.9 GW planned by 2030 | Expanding |
| Battery storage | ~2.0 | 0.4% | 41.7 GW / 208.3 GWh planned by 2030 | Critical |
| Total firm capacity | ~280 | ~54% | Available as firm at any given time | Constraint |
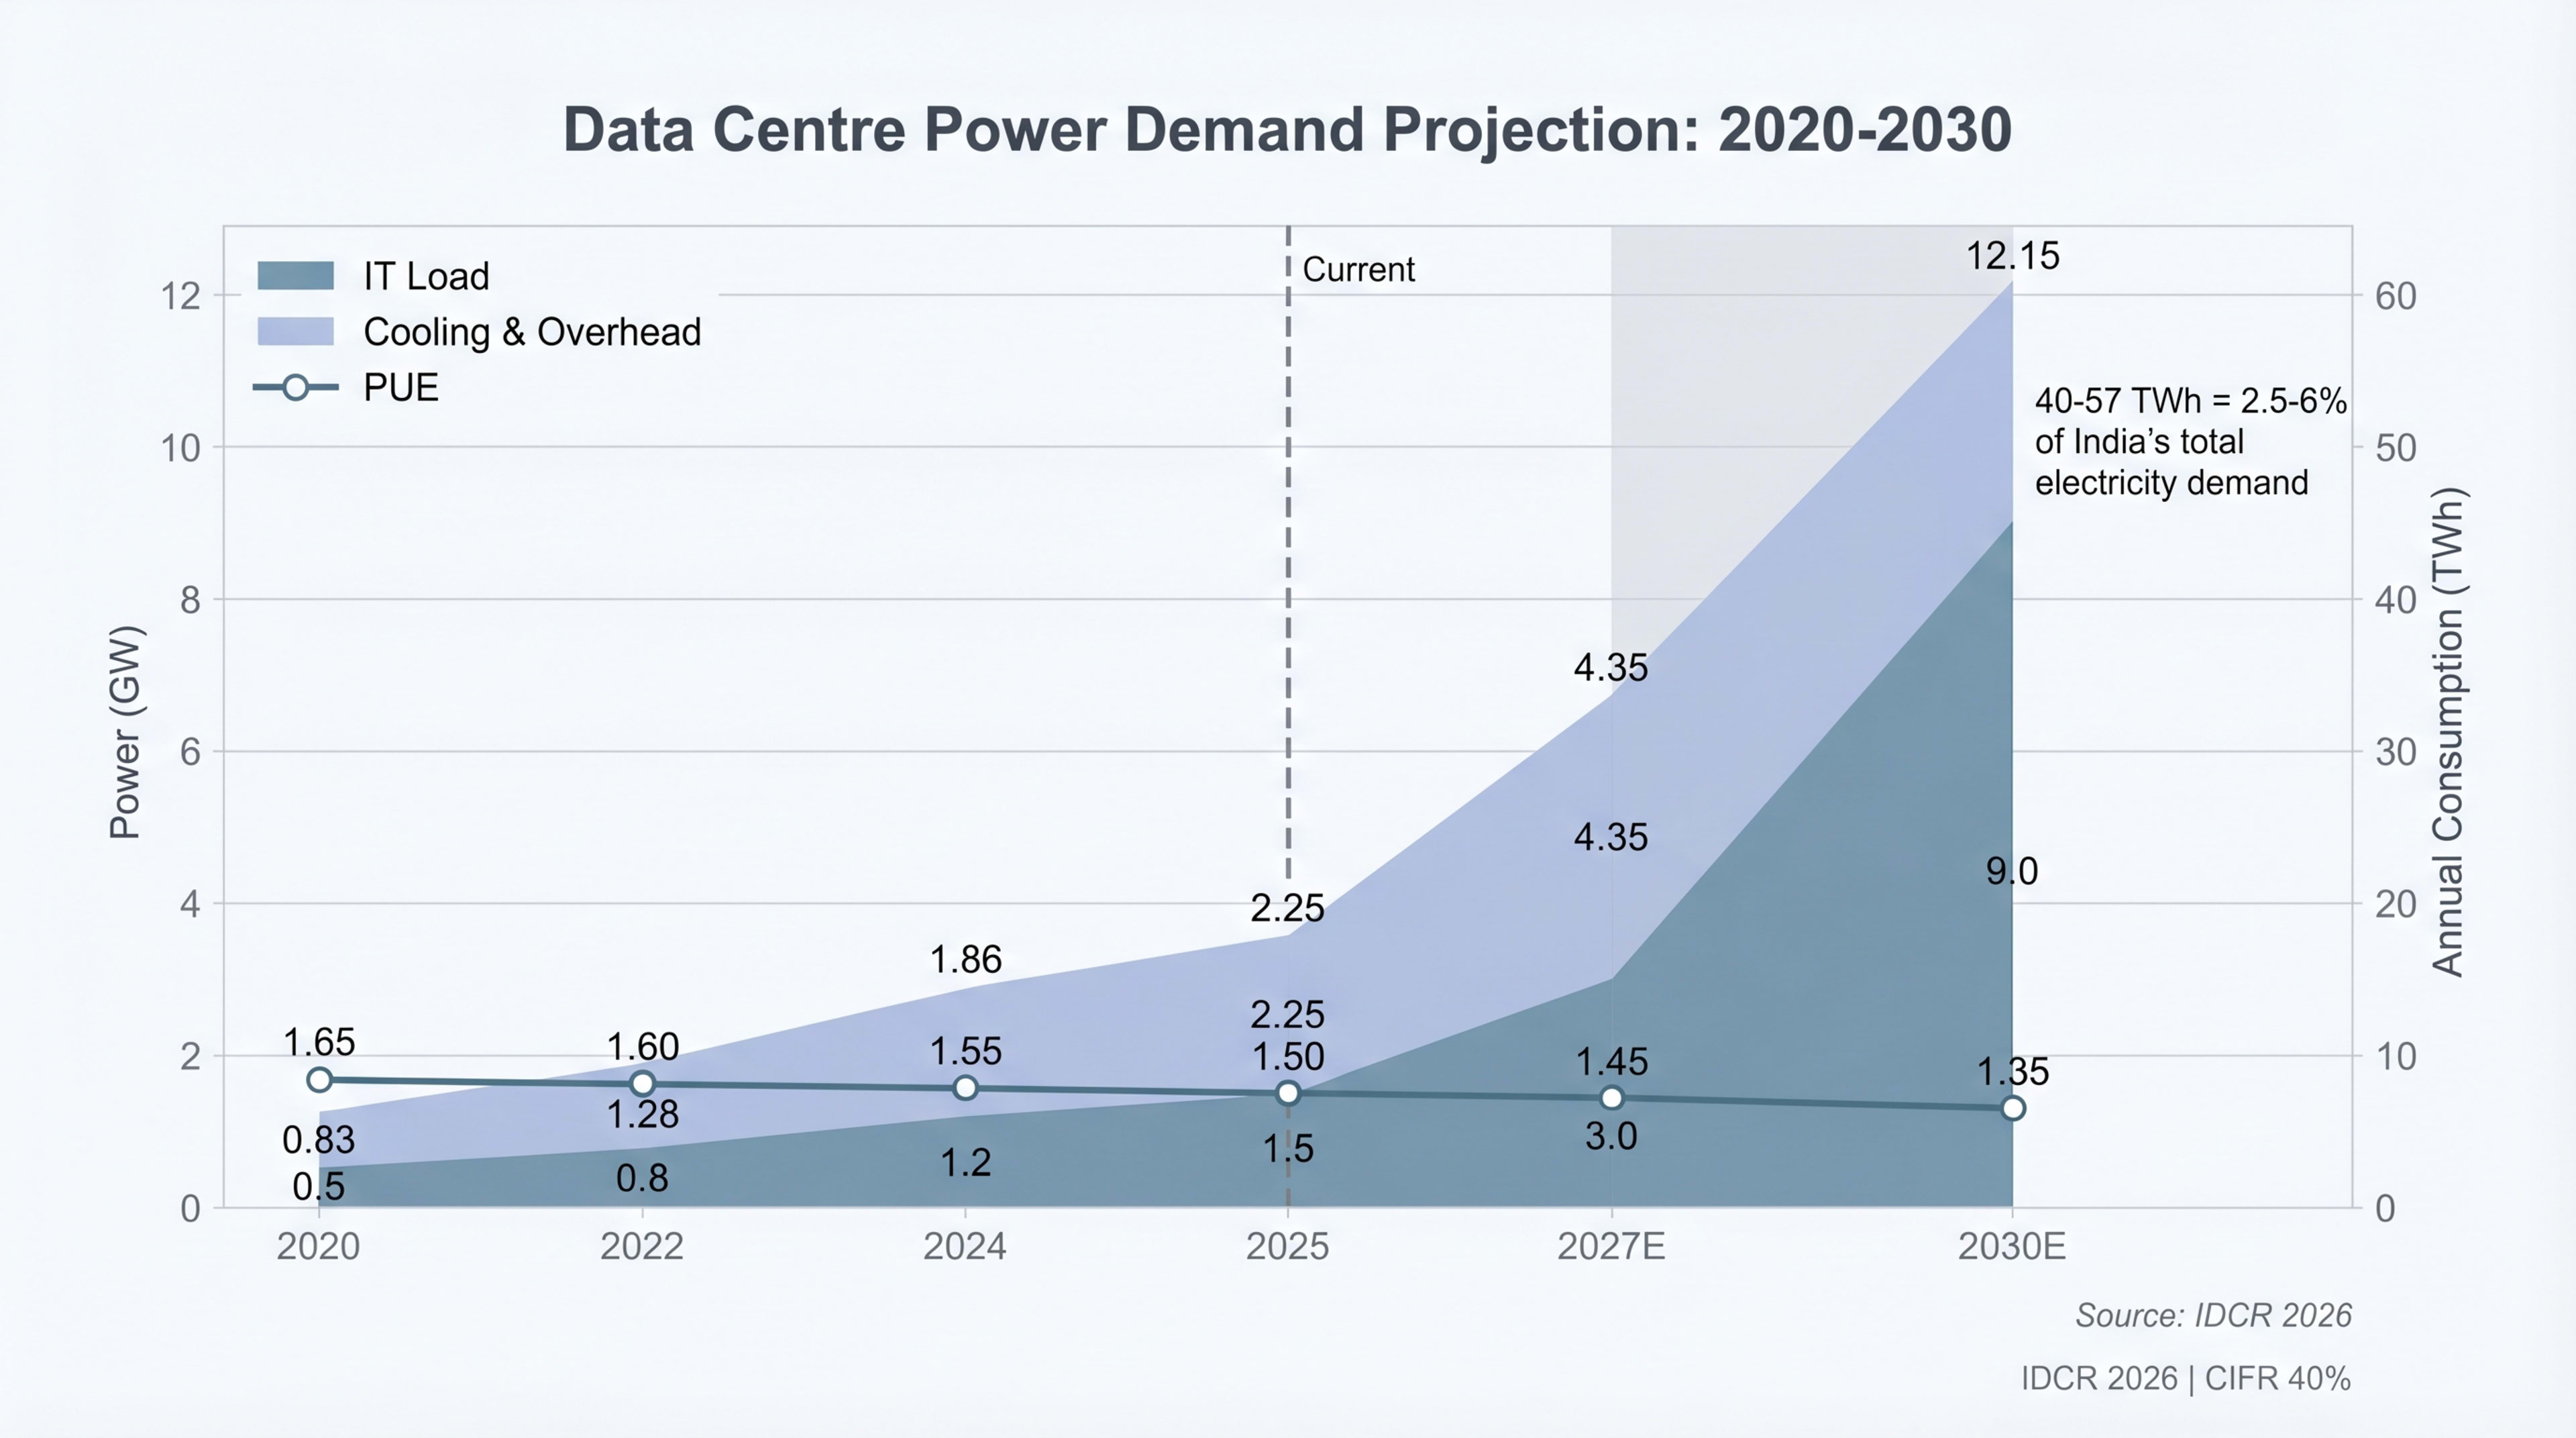
Data centres consumed an estimated 13 TWh in 2024, ~0.8% of India's 1,650 TWh national consumption (S&P Global· S&P Global2025; IEEFA· IEEFA). Capacity will grow from 1.5 GW (2025) to 6.5–9 GW by 2030 (base case 6.5 GW; see Chapter 14 — Outlook). Annual consumption will reach 40-57 TWh — 2.5-6% of projected national demand. For perspective, India's aluminium-smelting industry, the most power-intensive sector today, consumes 35 TWh/year. By 2030, data centres will approach or exceed it.
April 2026 broke the pattern. India met an all-time high peak of 256.1 GW at 15:38 IST on 25 April 2026 — surpassing the prior 250 GW record from May 2024 — and did so while continuing to export to neighbours, with thermal contributing 67% of generation, solar 21%, and hydro 4.4% (Ministry of Power· Ministry of PowerApr 2026). Year-on-year consumption growth for April 1-27 was 8.9%. The grid added 65 GW of fresh generation capacity over FY2026, the largest annual addition on record. Live grid frequency and stability and load forecasts are tracked continuously on the atlas.
| Year | Capacity (GW) | Avg PUE | Power draw (GW) | Annual TWh | Share of demand |
|---|---|---|---|---|---|
| 2020 | 0.5 | 1.65 | 0.83 | ~7 | ~0.5% |
| 2022 | 0.8 | 1.60 | 1.28 | ~10 | ~0.6% |
| 2024 | 1.2 | 1.55 | 1.86 | ~13 | ~0.8% |
| 2025 | 1.5 | 1.50 | 2.25 | ~17 | ~1.0% |
| 2027E | 3.0 | 1.45 | 4.35 | ~32 | ~1.7% |
| 2030E | 6.5–9.0 | 1.35 | 12.15 | 40–57 | 2.5–6.0% |
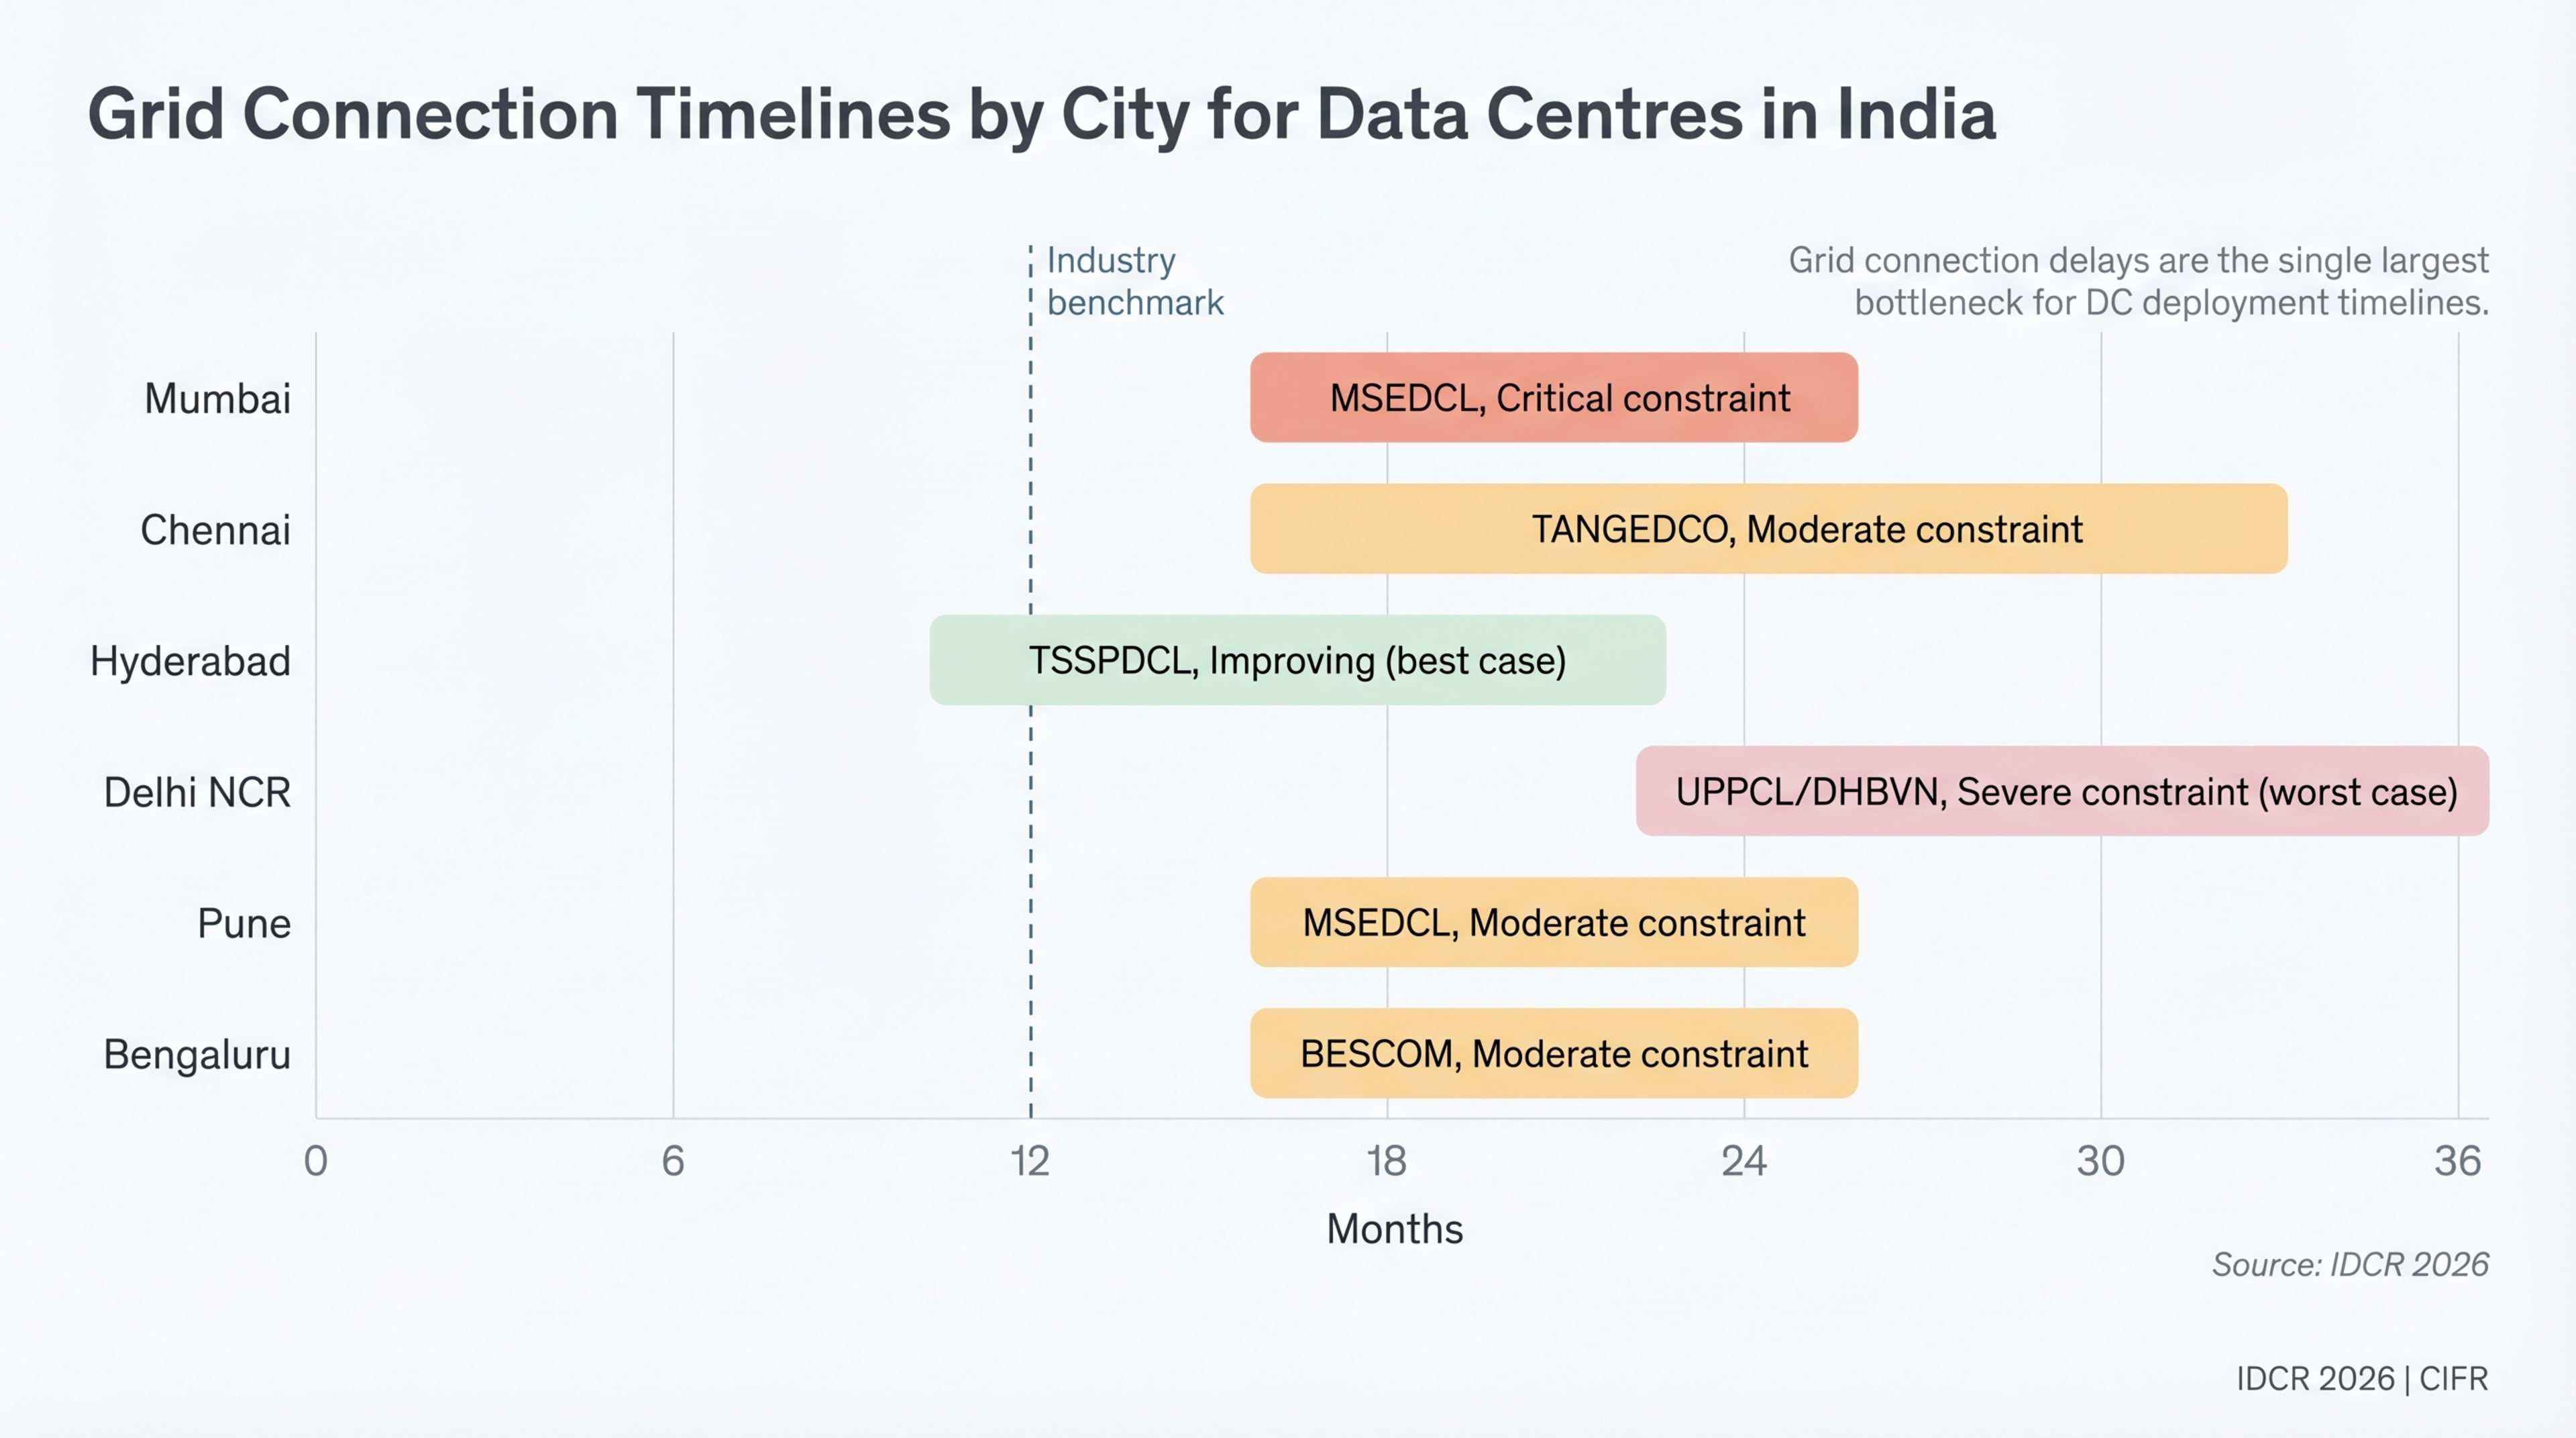
Securing an HT or EHT connection from a state DISCOM takes 18-36 months in major markets. This — not capital, land, or demand — sets the deployment ceiling.
- Mumbai (MSEDCL, Adani Electricity, Tata Power): 33 kV and 110 kV connections require load sanction, substation augmentation, and feeder construction. Timeline 18-24 months. Live state load: Maharashtra dashboard.
- Hyderabad (TSSPDCL): proactive DC policy compresses timelines to 12-18 months for 132 kV. Telangana dashboard.
- Physical infrastructure — transformers, switchgear, feeder capacity — cannot be manufactured at the pace of facility construction.
| City | DISCOM/Utility | Voltage Level | Typical Timeline | Bottleneck | Status |
|---|---|---|---|---|---|
| Mumbai | MSEDCL/Adani/Tata | 33–110 kV | 18–24 mo | Substation capacity | Critical |
| Chennai | TANGEDCO | 33–110 kV | 18–30 mo | Transformer lead times | Moderate |
| Hyderabad | TSSPDCL | 33–132 kV | 12–18 mo | New 132 kV substations | Improving |
| Delhi NCR | UPPCL/DHBVN | 33–132 kV | 24–36 mo | Cross-state coordination | Severe |
| Pune | MSEDCL | 33–110 kV | 18–24 mo | Rural-to-industrial grid | Moderate |
| Bengaluru | BESCOM | 33–66 kV | 18–24 mo | Urban congestion | Moderate |
State-Level Power Tariffs: The Hidden Competitive Advantage
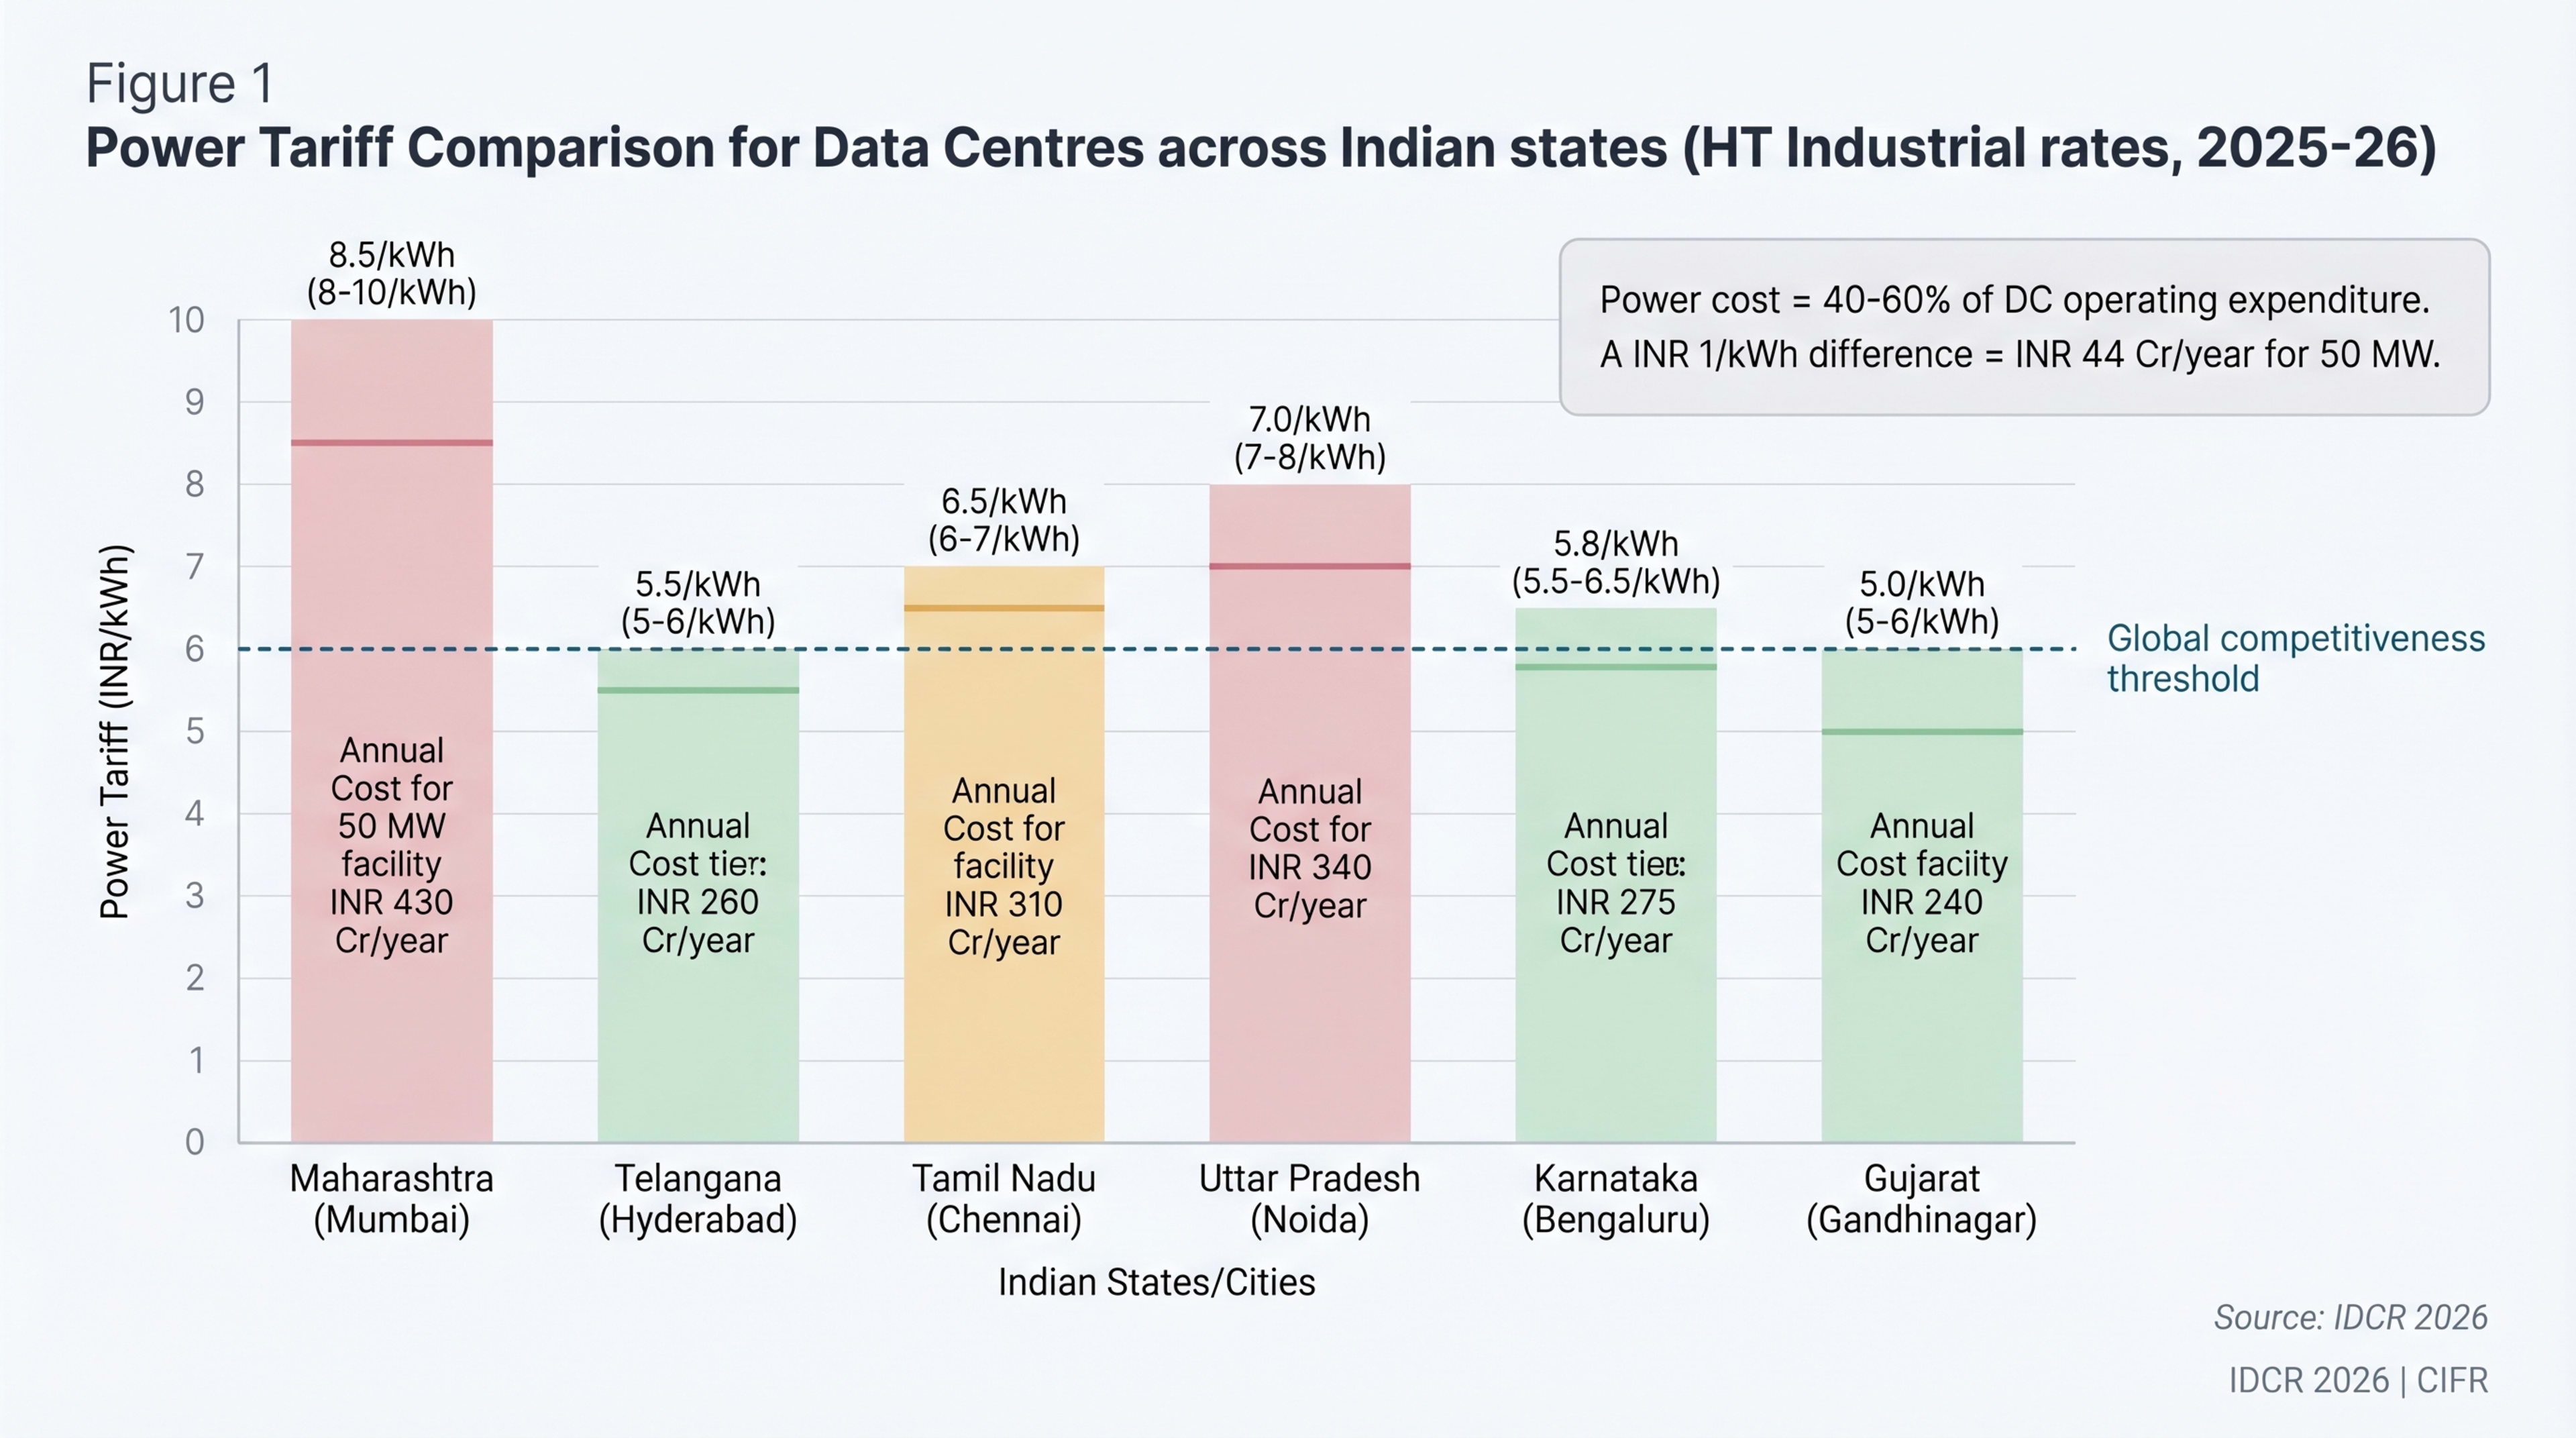
State power tariffs create structural cost advantages large enough to override every other location factor. A 50 MW data centre at 85% utilisation and 1.5 PUE faces ₹260 crore/year in Hyderabad (₹5.5/kWh) versus ₹430 crore/year in Mumbai (₹9/kWh) — a ₹170 crore differential, ~$20 M/year. Over ten years, that is $200 M per facility. Hyderabad and Chennai grow faster than Mumbai despite weaker connectivity primarily because of this tariff arbitrage.
India's national weighted average industrial tariff is $0.067/kWh (₹5.6/kWh) — about one-third of Singapore ($0.20/kWh) and half of US rates (CEA tariff order FY2025· CEA). State-level tariffs and DC-specific exemptions are tracked at /tariffs; the tariff-comparator tool models a load profile across states; the /pricing page shows live wholesale power prices.
| State/City | HT Tariff (₹/kWh) | DC-Specific Incentive | Effective Rate (est.) | Annual Cost (50 MW) |
|---|---|---|---|---|
| Maharashtra (Mumbai) | 8–10 | 60% exemption (15 yr) | ~8.5 | ~₹430 Cr |
| Telangana (Hyderabad) | 5–6 | Subsidised for green DCs | ~5.5 | ~₹260 Cr |
| Tamil Nadu (Chennai) | 6–7 | IT/ITeS tariff category | ~6.5 | ~₹310 Cr |
| Uttar Pradesh (Noida) | 7–8 | Exemption under DC policy | ~7.0 | ~₹340 Cr |
| Karnataka (Bengaluru) | 5.5–6.5 | Exempt (5 yr) + RE savings | ~5.8 | ~₹275 Cr |
| Gujarat (GIFT City) | 5–6 | SEZ benefits + Adani Green | ~5.0 | ~₹240 Cr |
“A 50 MW facility built in Hyderabad pays ₹170 crore less per year for the same kilowatt-hours than one built in Mumbai. Over a decade, that is $200 million per facility — a structural advantage no operational lever can match.
”
Data Centres Are Becoming Utilities: The Google–Andhra Pradesh Discom Precedent
The most consequential power-sector signal of 2026 is not a new tariff or a CEA report. It is a state cabinet granting a hyperscaler the legal right to be its own electricity distribution company.
In April 2026 the Andhra Pradesh cabinet approved a power-distribution licence for Google's $15 billion Visakhapatnam data-centre hub — making Google (via its Indian subsidiary Raiden Infotech and a JV with Adani Infra) the first private company in AP to receive a discom licence (Power Peak Digest· Power Peak DigestApr 2026; Varindia· VarindiaApr 2026). Groundbreaking happened on 28 April 2026; commissioning is targeted for July 2028 (Google Press Corner· GoogleApr 2026).
The licence permits Google to procure and distribute electricity directly to its 1 GW campus across Adavivaram, Tarluvada, and Rambilli — bypassing the conventional DISCOM-tariff stack entirely. Three structural implications follow:
- Power becomes capex, not opex. Electricity is 40–60% of a hyperscale DC's operating cost. With a discom licence, the operator owns the upstream — long-term PPAs at fixed tariffs, captive renewable integration, and direct grid-balancing relationships with Grid-India· Grid-India. Live Andhra Pradesh grid context: load, fuel mix, and surplus generation profile.
- Tariff arbitrage compresses. State competition in the table above (₹5–10/kWh range) was built on DISCOM-mediated industrial tariffs. A discom-licensed hyperscaler effectively negotiates one tier upstream, with state regulators rather than DISCOMs.
- The model is replicable. Andhra Pradesh published a parallel framework allowing data centres themselves to apply for distribution licences (Whalesbook· Whalesbook2026). Telangana and Karnataka are watching closely; Maharashtra, with its 18-month MSEDCL queue, faces the hardest political-economy decision.
This is not a one-off concession. It is the regulatory acknowledgement that a 1 GW campus is no longer a customer of a utility — it is a utility, with the same scale of load as a mid-size Indian city. The 2030 power-infrastructure map will be redrawn around which states grant these licences and which do not.
Keep reading — free, takes 30 seconds
Power Infrastructure: The Gating Variable continues with 1,159 words and 6 figures.
Free Clerk account. No card. We use it to remember your reading position and unlock subscriber chapters.