Water Stress and Cooling
Water stress by basin, cooling technology trade-offs, and the permit tightening that is reshaping site selection across India's five largest markets.
India's data centres consume 150 billion litres of water annually—projected to reach 358 billion litres by 2030. 60–80% of facilities face high water stress. The cooling technology transition from evaporative to liquid cooling is essential for water security and grid capacity.
Live state water-stress context: Maharashtra · Karnataka · Tamil Nadu · Telangana. Cross-link to /insights.
India's Data Centres Consume 150 Billion Litres Annually
Water is the invisible input of data centre operations. Every megawatt of IT load requires continuous heat rejection; in India's tropical and semi-arid climate zones, evaporative cooling consumes large volumes of water lost to the atmosphere. A 100 MW hyperscale facility using water-based evaporative cooling consumes approximately 800,000 litres per day for on-site cooling alone—equivalent to the daily water needs of ~16,000 Indian households (CEEW 2025).
India's data centres consumed approximately 150 billion litres of water in 2024--25 (CEEW 2025). With IT load capacity projected to grow from 1.4 GW to 6.5--17 GW by 2030, water consumption will reach 358 billion litres annually—a 2.4x increase (CEEW/JLL estimates). S&P Global (2025) projects that 60--80% of India's data centres will face high or extremely high water stress within this decade as facilities cluster in cities already struggling with supply deficits.
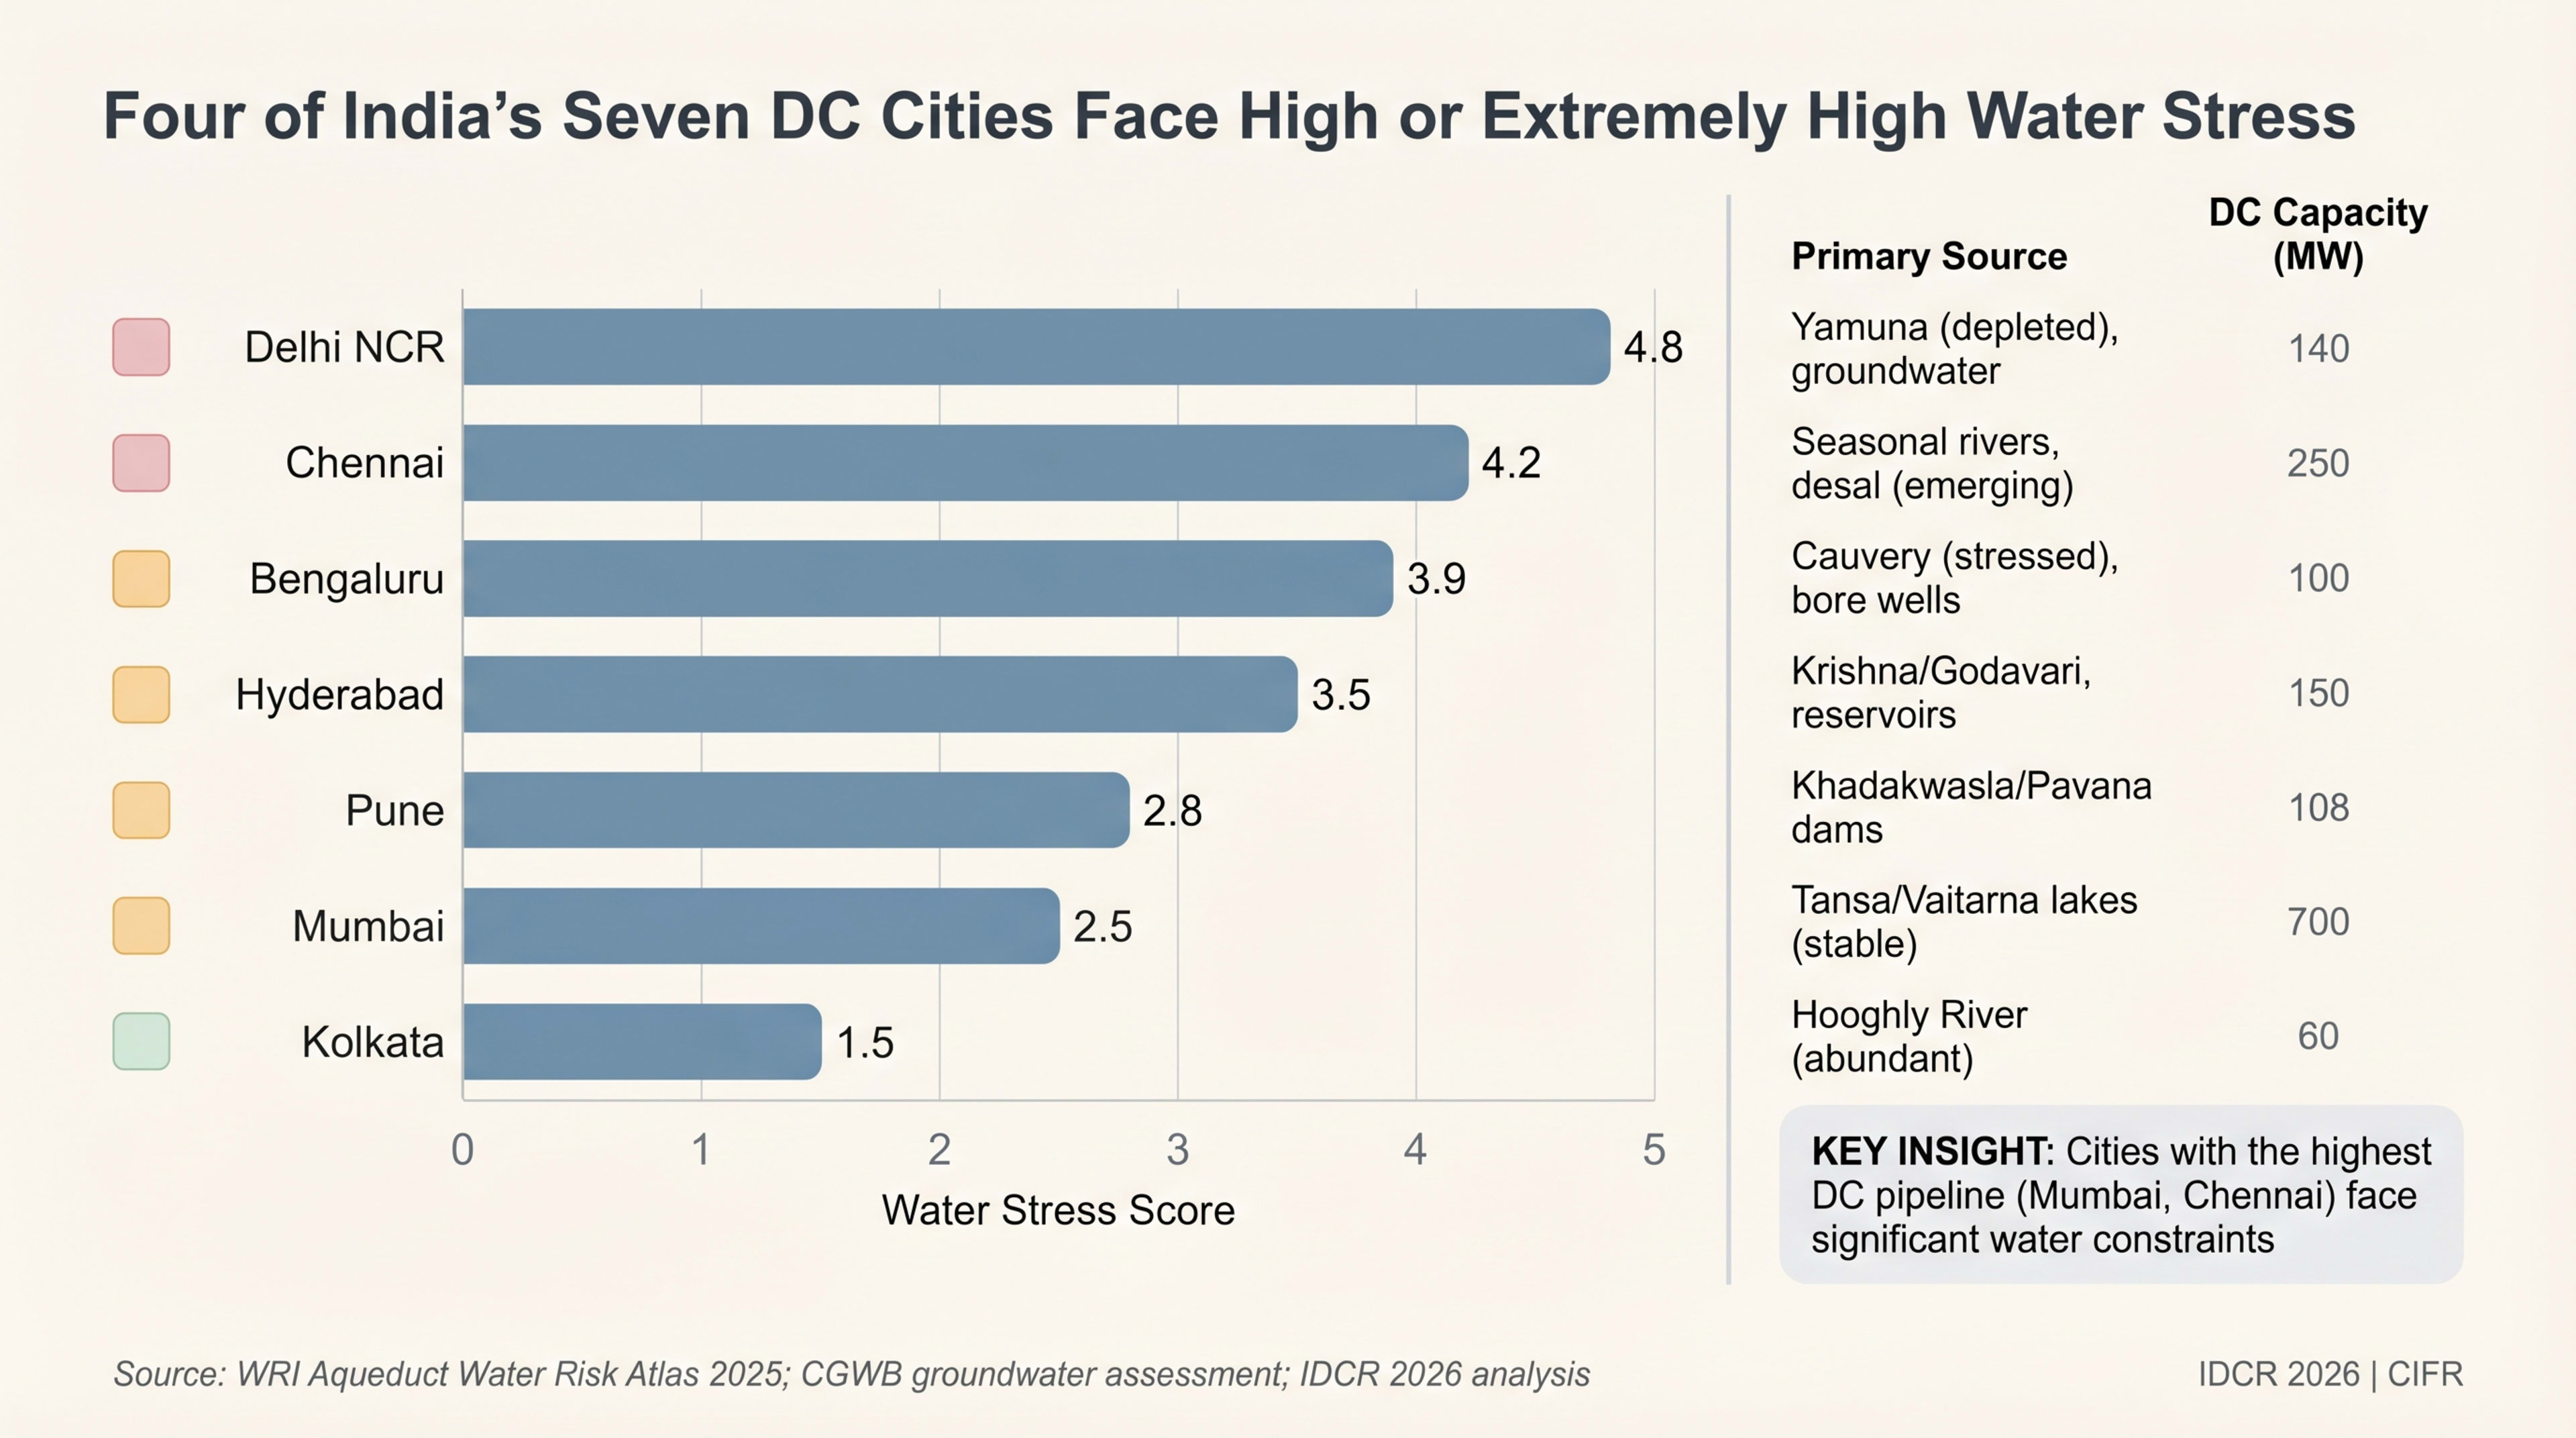
Geography constrains growth: India's top four data centre markets—Mumbai, Chennai, Hyderabad, and Bengaluru—host ~75% of national capacity but face severe water scarcity. Chennai experienced a near-zero day in 2019 when municipal reservoirs ran dry. Hyderabad faces a projected shortfall of 909 million litres per day for domestic and industrial use by 2027--28. These cities simultaneously are adding hundreds of megawatts of new data centre capacity.
Source: CEEW 2025; S&P Global Sustainable1 2025; CGWB Dynamic Ground Water Resources 2023; Down to Earth India 2025
| City | IT Load (MW) | Est. Water Use (BL/yr) | Water Stress Level | Primary Source | Key Risk |
|---|---|---|---|---|---|
| Mumbai | 520 | 40 | Medium-High | Municipal (BMC) | Monsoon dependency; ageing pipe network |
| Chennai | 200 | 18 | Extremely High | Desal + Groundwater | Near-zero day (2019); depleting aquifers |
| Hyderabad | 180 | 16 | High | Krishna River + GW | 909 ML/day deficit projected by 2028 |
| Bengaluru | 120 | 11 | High | Cauvery + Tankers | Groundwater over-extraction; Cauvery quota disputes |
| Pune | 80 | 7 | Medium | Municipal (PMC) | Seasonal supply variability |
| Delhi-NCR | 100 | 9 | Extremely High | Yamuna + Groundwater | CGWB: "over-exploited" aquifer classification |
| Kolkata | 30 | 3 | Low-Medium | Hooghly River | Salinity intrusion risk |
Source: CEEW 2025; CGWB Dynamic Ground Water Resources 2023; S&P Global 2025; Municipal water board disclosures; India Energy Atlas estimates for IT load allocation
India's data centres are concentrating in precisely the cities facing the worst water stress. Chennai, Hyderabad, and Delhi-NCR---all rated "High" or "Extremely High" water stress by CGWB---are simultaneously adding hundreds of megawatts of new DC capacity. Without a technology transition away from evaporative cooling, data centres risk becoming direct competitors with households and agriculture for a shrinking water budget.
The WUE Transparency Gap
Water Usage Effectiveness (WUE)—measured in litres per kilowatt-hour (L/kWh)—is the standard metric for data centre water efficiency, analogous to PUE for energy. The Green Grid defines WUE as total site water usage divided by IT equipment energy consumption.
No major Indian data centre operator publicly reports facility-level WUE. Down to Earth's 2025 investigation found zero transparency across the sector. Nxtra discloses aggregate water recycling volumes (13,488 KL in FY25) but not WUE per facility. STT GDC, CtrlS, Yotta, and Sify publish no water efficiency metrics. Equinix and Google report WUE for worldwide portfolios but do not break out India-specific figures. This transparency deficit is examined in detail in Chapter 13.
| Facility Type | WUE (L/kWh) | Annual Water / MW | Cooling Method | Reporting Status |
|---|---|---|---|---|
| India — Evaporative (Typical) | 1.8–2.5 | 16–22 ML | Evaporative | Not publicly reported |
| India — Chiller-based (Est.) | 1.0–1.5 | 9–13 ML | Chilled water | Not publicly reported |
| Google (Global Avg.) | 0.84 | 7.4 ML | Mixed | Published annually |
| Meta (Global Avg.) | 0.26 | 2.3 ML | Direct evap. | Published annually |
| Equinix (Global Avg.) | 0.48 | 4.2 ML | Mixed | Published annually |
| Best-in-Class (Air-cooled) | 0 | 0 | Liquid / Air | N/A |
Source: Google Environmental Report 2024; Meta Sustainability Report 2024; Equinix ESG Report 2024; Uptime Institute Global DC Survey 2025; India Energy Atlas estimates for India
Keep reading — free, takes 30 seconds
Water Stress and Cooling continues with 2,127 words and 16 figures.
Free Clerk account. No card. We use it to remember your reading position and unlock subscriber chapters.